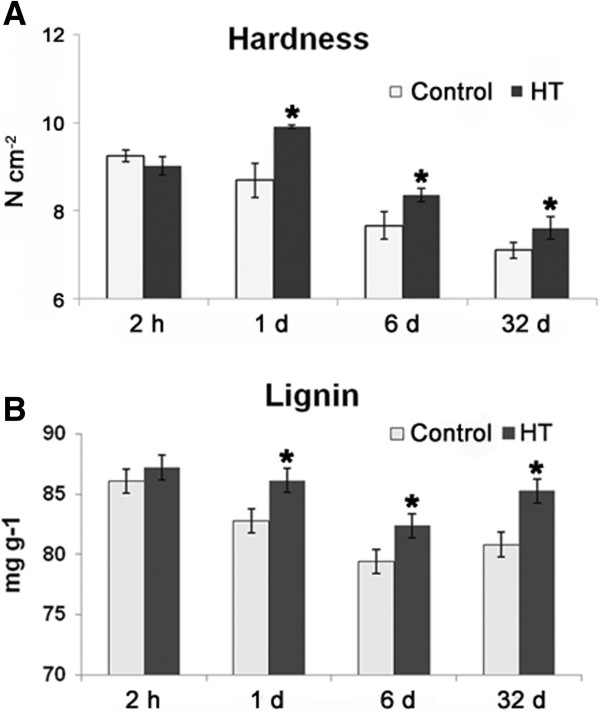
Figure 5.

Changes of fruit hardness (A) and lignin content (B) in HT and control pericarp. Samples at 2 h and 1, 6 and 32 DAT were used for fruit hardness and lignin content determination. An analysis of statistically significant differences was conducted between HT and control pericarp during the same period using Student’s t-test. *: significant difference (P < 0.05). Mean values and SE bars are provided.
