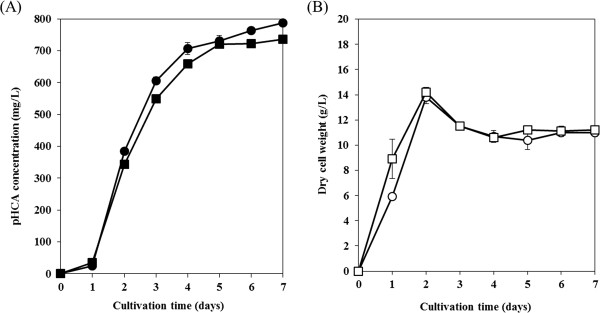
Figure 2.

pHCA production and the cell growth of RsTAL expressing S. lividans. (A) Time-course of pHCA production in culture: S. lividans/pURsTAL cultured in modified TSB medium containing 1% glucose (closed circles) or 1% cellobiose (closed squares). (B) Change in the dry cell weight over time of S. lividans/pURsTAL cultured in modified TSB medium containing 1% glucose (open circles) or 1% cellobiose (open squares). Each data point shows the average of three independent experiments, and error bars represent the standard deviation.
