
Figure 10.
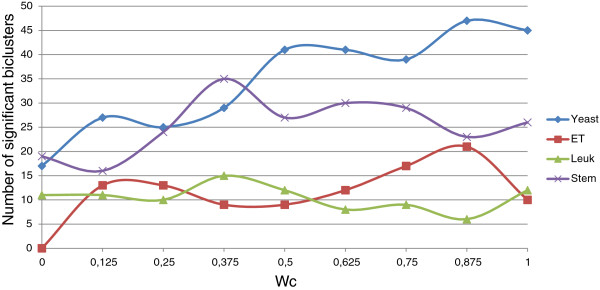
Number of significant biclusters for differentwc values. Ordinates axis represents the number of significant biclusters obtained for each dataset and the wc values in abscissa axis, being the adjusted p-value 0.05.
Official websites use .gov
A
.gov website belongs to an official
government organization in the United States.
Secure .gov websites use HTTPS
A lock (
) or https:// means you've safely
connected to the .gov website. Share sensitive
information only on official, secure websites.
Number of significant biclusters for differentwc values. Ordinates axis represents the number of significant biclusters obtained for each dataset and the wc values in abscissa axis, being the adjusted p-value 0.05.