Figure 12.

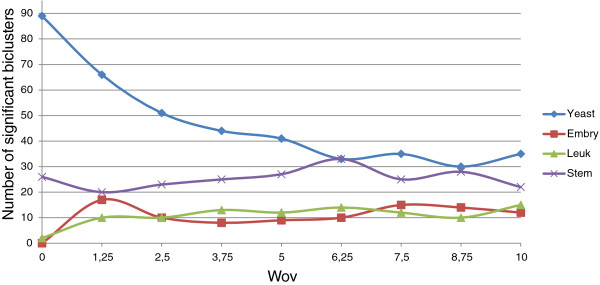
Number of significant biclusters for differentwov values. Ordinates axis represents the number of significant biclusters obtained for each dataset and the wov values in abscissa axis, being the adjusted p-value 0.05.

Number of significant biclusters for differentwov values. Ordinates axis represents the number of significant biclusters obtained for each dataset and the wov values in abscissa axis, being the adjusted p-value 0.05.