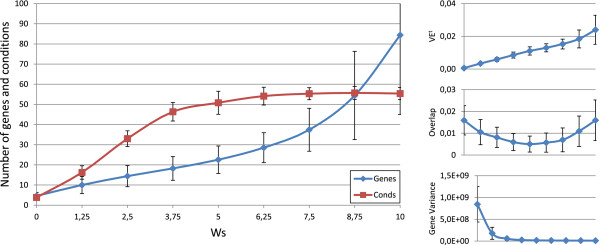
Figure 5.

ws influence over the different bicluster features. Main graphic shows the variations of the means and deviations of both the number of genes and conditions, depending on the values of ws in abscissa axis. At the right side of the main graphic, the way in which the variations of ws affects VE t, overlap and mean gene variance has also been represented.
