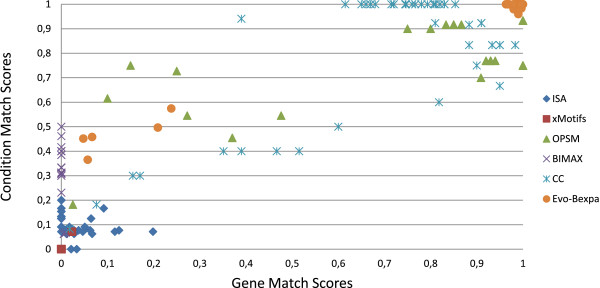
Figure 8.

Gene and condition match scores for ISA, xMotifs, OPSM, BIMAX, CC and Evo-Bexpa in synthetic experiments. X-axis represents gene match scores and Y-axis represents condition match scores. Each dot in the graphic refers to the comparison of a bicluster found by each algorithm and its equivalent solution. Dots in the right top corner of the graphic correspond to those obtained biclusters which have a better match with its equivalent solution.
