Figure 6.
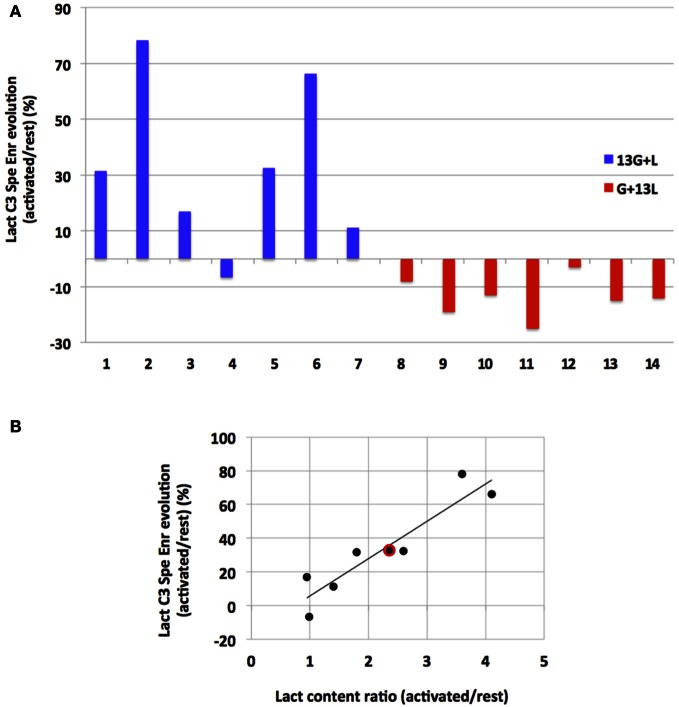
Evolution of lactate C3 specific enrichment for each rat (A) and correlation between its evolution and lactate content during activation (B). (A) Evolutions of lactate C3 specific enrichment (activated over rest, %) are presented for each independent experiment after infusion with [1-13C]glucose+lactate (n=7, rat 1 to rat 7, blue) or with glucose + [3-13C]lactate (n=7, rat 8–14, red). (B) Linear regression between lactate concentration increase (ratio between lactate content measured in the activated S1BF and the one measured in the rest S1BF on 1H-NMR spectra) and lactate C3 specific enrichment increases (values in A, blue) for the [1-13C]glucose + lactate condition (rat 1–7). Red dot represents the mean values in this latter condition (a 2.4-fold increase in the lactate content, and a 33% increase in lactate C3 specific enrichments). r2= 0.86.

