
Figure 5.
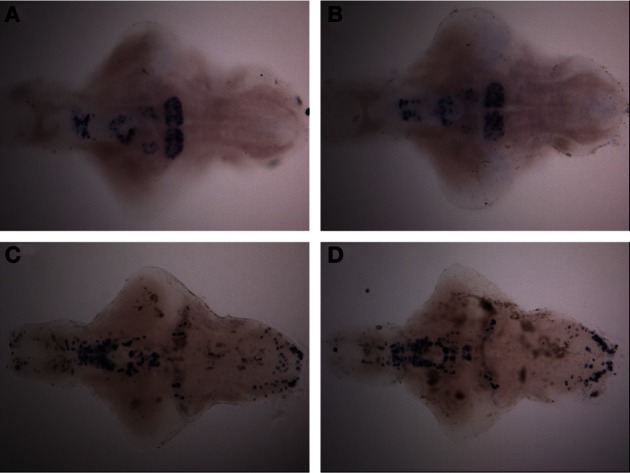
Expression pattern of th1 and th2 after a 30-min ethanol treatment. (A) th2 expression pattern after 30-min of 1.50% ethanol. (B) th2 expression in the control group. (C) th1 expression pattern after 30-min of 1.50% ethanol. (D) th1 expression in the control group. No differences can be seen between the groups. N = 10 larvae per treatment group.