FIGURE 1.
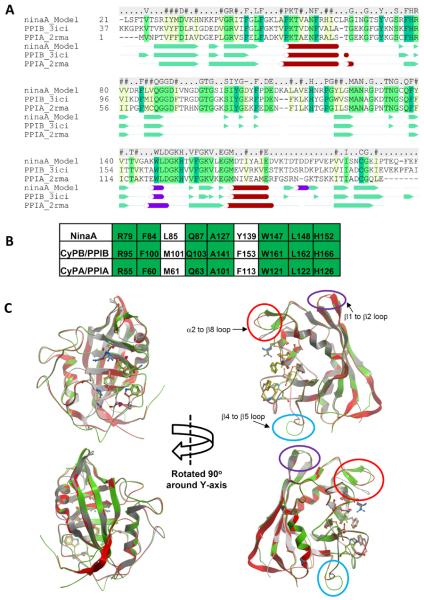
Molecular modeling of NinaA to CyPB/PPIB and CyPA/PPIA. (A) Sequence alignment of NinaA, CyPB/PPIB, CyPA/PPIA. Identical and conserved residues are highlighted in green and yellow, respectively. NinaA exhibits 49% and 43% identity to CyPB/PPIB and CyPA/PPIA, respectively. Consensus sequence is noted above the alignment. Consensus of secondary-structure elements are shown below the primary sequence alignment. The secondary structure assignment is taken from the PDB files 2rma and 3ici for CyPA/PPIA and CyPB/PPIB, respectively, and the model of NinaA. Legend: Green arrows and solid green triangles, β-sheet; red cylinders and spheres, α-helices; purple cylinders, non-canonical helices. (B) Conservation of residues comprising the PPIase active site of NinaA, CyPB/PPIB and CyPA/PPIA. Identical residues are highlighted in green. (C) Structural superposition of the NinaA model (green ribbon), the CyPB/PPIB template crystal structure (red ribbon), and the CyPA/PPIA crystal structure (grey ribbon). The residues of the PPIase active site are shown in stick representation and the carbon atoms are colored red and orange, respectively. The main structural differences between the three structures are in three loop regions: β1 to β2 (circled in purple), β4 to β5 (circled in light blue), and β2 to β8 (circled in red). The β1 to β2 loop turn is conserved between the NinaA model and the PPIB template and this turn differs from the turn seen in PPIA structures. A two residue insertion in the β4 to β5 loop in NinaA gives rise to a different loop structure in this region compared to PPIA and PPIB. The α2 to β8 loop is one residue shorter in PPIA and therefore differs to the loops seen in NinaA and PPIB. The modeling indicates that there may be an additional β-sheet in this loop in NinaA compared to PPIA and PPIB.

