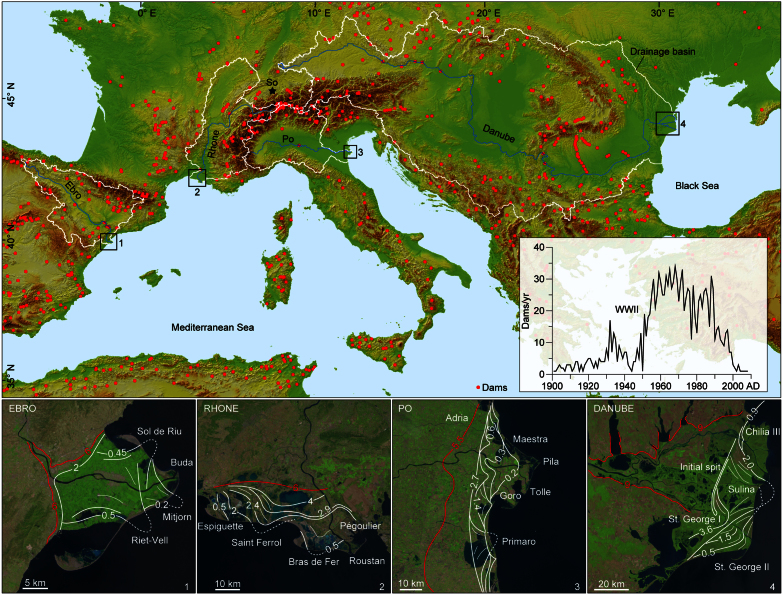
Figure 1. Location of the four delta systems with catchments and growth phases.
Drainage basins of the largest southern European river systems on SRTM 90 m Digital Elevation Data (CGIAR-CSI), with major dams and reservoirs (red dots) and location of the Soppensee Lake (black star; see pollen spectra in Figure 3). The inset graph shows the number of river dams built per year since 1900 AD; the temporary decline in dam construction in the '40 can be attributed to the Second World War (see Supplementary S5). Below: satellite views of modern deltas (from the Landsat Archive and the Global Land Survey), with red lines representing their embryonic stages, during the last phases of post-glacial sea level rise (between 9 and 5.5 kyr BP), and the white lines representing the main dated progradational events of delta growth (see Supplementary S3).

