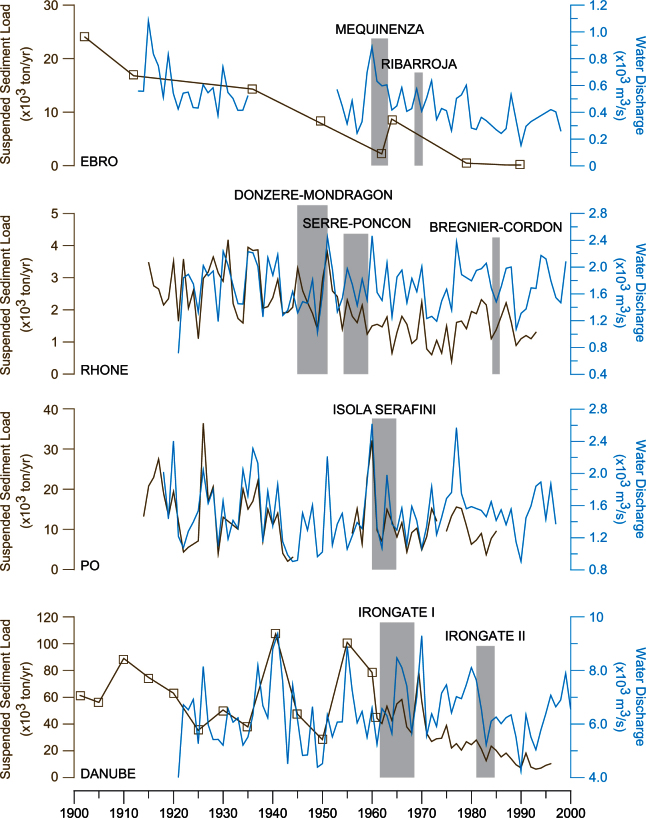
Figure 4. Modern water and sediment flux.
Coupled diagram of suspend sediment load (brown) and fresh water (light blue) demonstrating the impact of anthropic reservoirs on river discharge in all four Mediterranean deltas; gray stripes highlight the timing of construction of major dams (Supplementary S3 and S5). Peaks of water discharge are in phase with peaks in suspended sediment load only before dam's construction until the '60.

