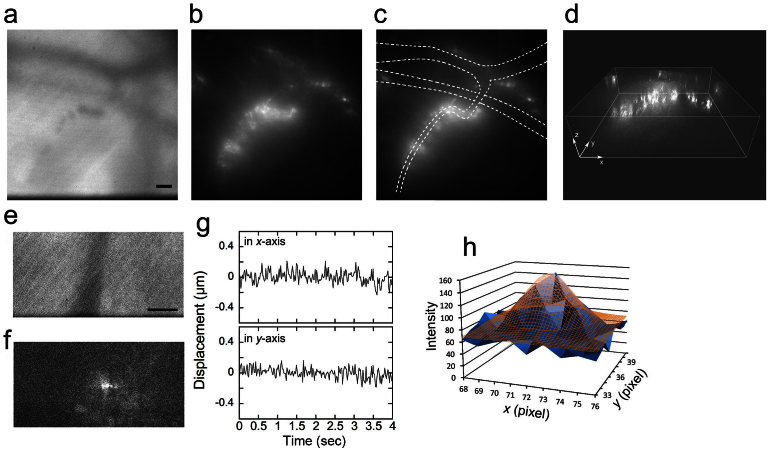
Figure 4. Neutrophils forming a cluster around the blood vessel after induction of inflammation.
Inflammation was induced in the mouse auricle via the application of TPA (0.1 mg/ml). (a) A transillumination image of blood vessels at a depth of 70 μm. The images were captured at 30 msec/frame soon after the induction of inflammation and averaged over successive two images. The bar indicates 10 μm. (b–d) By controlling the focal position of the objective with a piezoelectric actuator, a 3D fluorescent image of the neutrophils clustering around the blood vessel was reconstructed. A scanning session of 40 confocal images taken with 1.0-μm movements of the objective in 4.5 s was repeated 5 times. (b) A 2D fluorescent image reconstructed from one set of 40 images. (c) The lumen of the blood vessels was estimated from the transillumination image, which was averaged over successive 50 images, and is represented by broken lines, demonstrating that the neutrophils did not bind to all of the vascular walls. (d) A reconstructed 3D image. Movies of the fluorescent image are available in Supplementary Movies 2 and 3. (e and f) An image of a vesicle within another neutrophil on the vascular wall, 50 μm below the skin surface, was captured at 20 msec/frame, 6 hours after the induction of inflammation. A transillumination image (e) and fluorescent image (f) of the same position were averaged over successive two and five images, respectively. The bar indicates 10 μm. The position of the vesicle was tracked using the FIONA method on the images averaged over successive 5 images (g). The distribution (SD) of the position was 78 nm along the x-axis and 69 nm along the y-axis. No directional movement was observed. (h) An example of 2D Gaussian fitting to the vesicle by the FIONA method15. The intensity of the vesicle (blue solid) was fitted by 2D Gaussian (brown mesh). Center position (x0, y0) was (71.68, 37.74) pixels. Width of one pixel corresponds to 223 nm. Other fitting parameters are shown in Supplementary Table S1.

