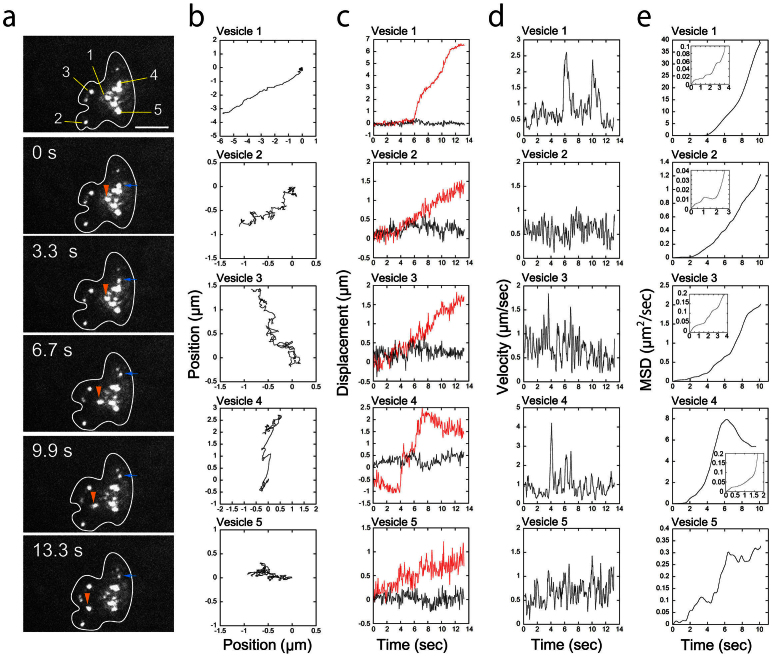
Figure 7. High-speed vesicle transport within a neutrophil moving in the interstitium.
(a) Successive fluorescent images of vesicles within a neutrophil moving in the interstitium 50 μm below the skin surface. The images were obtained at 13.3 msec/frame. Each image shown here was averaged over 100 successive images. The bar indicates 10 μm. The vesicles in the cell were designated as Vesicle 1–5. The positions of Vesicle 1 and 4 are indicated by orange and blue arrowheads, respectively. The shape of the cell was estimated from images that were averaged over 250 successive images and is indicated by white lines7. (b) Two-dimensional traces of each vesicle over 13.3 seconds. The fluorescent images were averaged four times to get clear images of the vesicles brighter than 40 photons/vesicle, and the two-dimensional trace of each vesicle was tracked using the FIONA method. The fitting parameters are available in Supplementary Table S1. (c) The displacement of each vesicle along the axis rotated relative to the vesicle movement. The red lines indicate displacements parallel to the rotated axis; the black lines indicate displacements perpendicular to the rotated axis. (d) Speed of each vesicle. The positions of 6 successive points were averaged, and the speed of each vesicle was calculated from the distance between these two successive positions. The data were smoothed by taking the moving average of three adjacent points. (e) MSD of each vesicle. Insets are enlargements of the MSDs at short time. A movie of the fluorescent image is available in Supplementary Movie 5.

