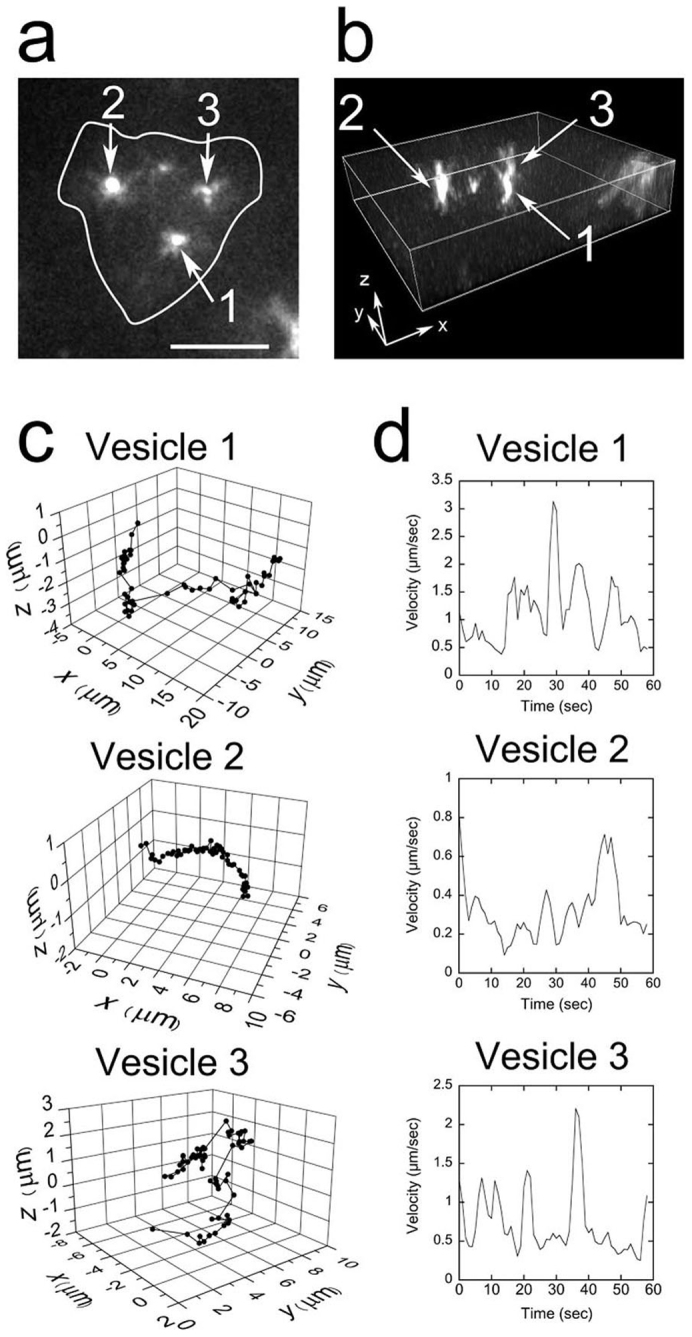
Figure 8. Three-dimensional tracking of vesicles within neutrophils in the interstitium.

A scanning session of nine confocal images taken with 1.0-μm movements of the objective in 1.1 s was repeated 60 times, allowing for the 3D tracking of the vesicle positions within a given cell 45 μm below the skin surface. (a) A fluorescent 2D image of the neutrophil. One set of nine confocal images was averaged. The bar indicates 10 μm. The vesicles in the cell were designated as Vesicle 1–3. (b) A reconstructed 3D image. The depth of the image was 9 μm. (c) Three-dimensional tracking of three vesicles. The focal (z) position of the vesicle was determined by fitting the intensity of the fluorescence with a Gaussian curve15. (d) The speeds of the vesicles. The data were smoothed by taking the moving average of three adjacent points. A movie of the fluorescent image is available in Supplementary Movie 6.
