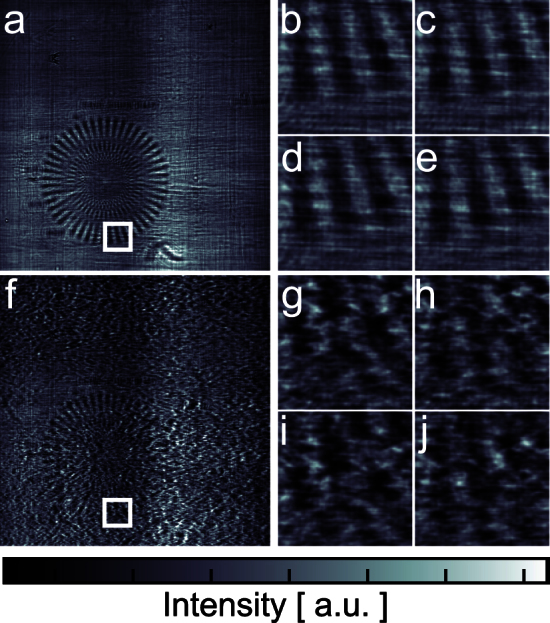
Figure 2. Near-field Fresnel diffraction patterns.

(a) one of the 16 diffraction patterns recorded without diffuser. The test sample is easily recognizable despite illumination inhomogeneities coming from the beamline optics. (f) diffraction pattern of the same area, when the diffuser is inserted in the beam. Enlarged details of the diffraction patterns covering the same region of the sample (depicted by the white box in (a) and (f)) for four different illumination positions are shown in (b–e) and (g–j). Larger variations between the images are observed in the dataset taken with the diffuser.
