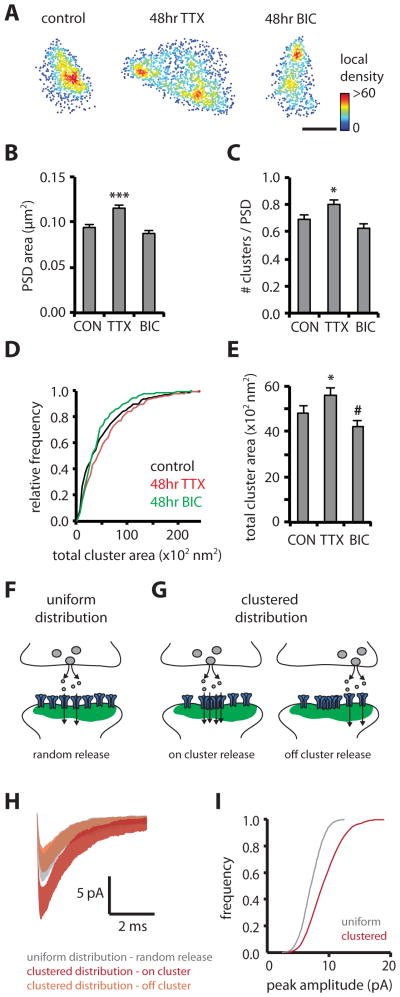
Figure 4. Subsynaptic structure is altered by synaptic activity and shapes postsynaptic responses.
(A) Examples of PSDs resolved with PALM comparing a control PSD with PSDs after chronic treatment with TTX or bicuculline (BIC). Scale bar, 200 nm.
(B) Mean PSD area for control, TTX and BIC treatment. ***, p < 0.001, Kruskal-Wallis.
(C) Mean number of clusters per PSD for control, TTX and BIC. *, p < 0.05, one-way ANOVA.
(D–E) Cumulative frequency distribution and mean of total cluster area for control, TTX and BIC. *, different from control, p < 0.05, #, p < 0.1, K-S test.
(F–G) Postsynaptic currents were simulated assuming randomly positioned release events on a uniform distribution of AMPARs (F), compared with release on and outside of a subsynaptic cluster of the AMPAR distribution measured in Figure 3E (G).
(H) Average mEPSC trace ± standard deviation of 50 runs for uniform distribution with random release locations compared with on and off cluster release for the clustered distribution.
(I) Cumulative frequency distribution of peak amplitude for simulated mEPSCs comparing randomly positioned release events (50 runs/location, 50 locations) on a uniform or clustered distribution of AMPARs.

