Figure 5.

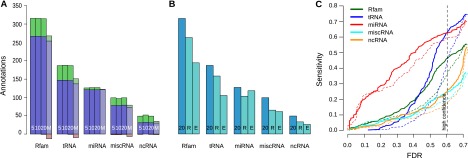
Sensitivity to Rfam and FlyBase ncRNA annotations in D. melanogaster. (A) Comparison of REAPR variants. Each group of four bars shows results for realignment with REAPR Δ = 5 (5), Δ = 10 (10), Δ = 20 (20), and MUSCLE (M). Each bar shows the number of annotations identified with realignment (blue + green), without realignment (blue + red), or both (blue). (B) REAPR versus previous screens by RNAz and EvoFold. For the same annotation classes, we show the predicted annotations by REAPR with Δ = 20 (20) and the previous screens by RNAz (R) and EvoFold (E), where we combined long and short predictions. (C) Sensitivity of predictions by REAPR (solid) or from the original WGA (dashed) to different ncRNA annotation classes as a function of the FDR.
