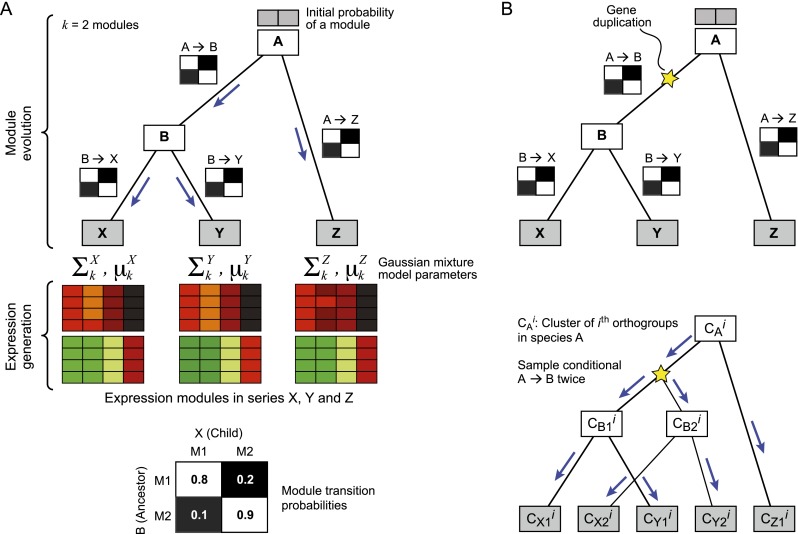
Figure 1.
Arboretum. (A) Generative model. Shown are the components of the generative model for a phylogeny with three extant species (X, Y, Z, gray rectangles) and two ancestral species (A, B, white rectangles) with k = 2 modules (heatmaps). The model consists of two parts: module evolution (top) and expression generation (bottom). Module evolution is modeled by transition matrices, one for every branch of the tree (black and white matrices on branches and bottom). The observed expression (heatmaps) is modeled by a mixture of Gaussians—one mixture for each extant species, one mixture component per module. The parameters of each Gaussian are shown on top of each species-specific module. For example, Σ1X and μ1X denote the covariance and mean of module 1 in species X. (B) Modeling module evolution of a gene family with duplication. (Top) Shown is a gene tree; (star) duplication event. All species after duplication (B, X, and Y) have two copies of the ancestral gene (B1, B2, X1, X2, and Y1, Y2). (Bottom) Module evolution procedure. (CAi) Module assignments of the ith orthogroup in species A. Module assignments post-duplication are denoted as, for example, CX1i and CX2i, for genes X1, X2 in species X. The assignments CB1i and CB2i are both sampled from the transition matrix of the phylogenetic point right after the duplication (B) and evolved independently down the rest of the subtree.

