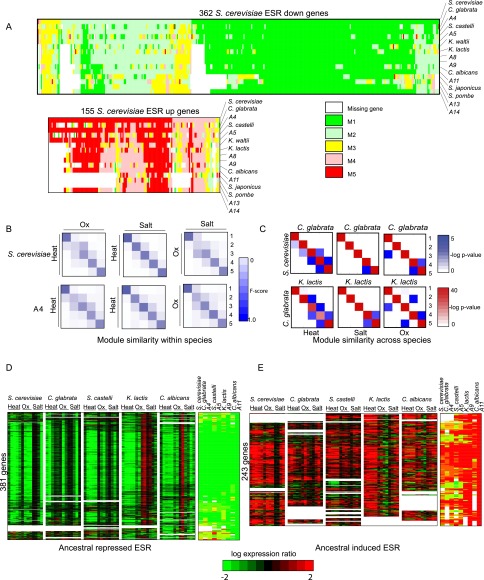
Figure 4.
Reconstructed evolutionary history of the environmental stress response. (A) Shown are the heat shock module assignments for each gene (column) in each extant and ancestral species (row) for genes previously observed as repressed in the ESR (top) and induced in the ESR (bottom) in S. cerevisiae. Rows are ordered using post-fix ordering (left: child; right: child and parent) of the species tree. Columns are ordered based on the module assignment of a gene in S. cerevisiae. (White) Gene lost in species. (B) Similarity of stress modules within a species. Shown is a comparison of modules identified by Arboretum in the transcriptional response to heat shock (Heat), oxidative stress (Ox), and salt stress (Salt) in S. cerevisiae (top) and ancestor A4 (bottom). Each matrix shows gene content conservation (F-score overlap) between all pairs of modules for one pair of conditions in one species. F-score overlap ranges from 0 (no overlap, white) to 1 (full overlap, dark blue). (C) Similarity of stress modules between species. Shown is the degree of overlap in orthologous genes between every pair of modules 1–5 (rows and columns in each matrix) for S. cerevisiae and C. glabrata (top) and C. glabrata and K. lactis (bottom) in heat, salt, and oxidative stress. Black intensity is proportional to −log (P-value) of the hypergeometric distribution. (D,E) Ancestral ESR. Shown are the expression profiles and Arboretum assignments of genes assigned to the most repressed (D) and most induced (E) modules of the LCA, A11 in a pan-stress Arboretum analysis. Genes corresponding to these panels are provided in Supplemental Table 4.

