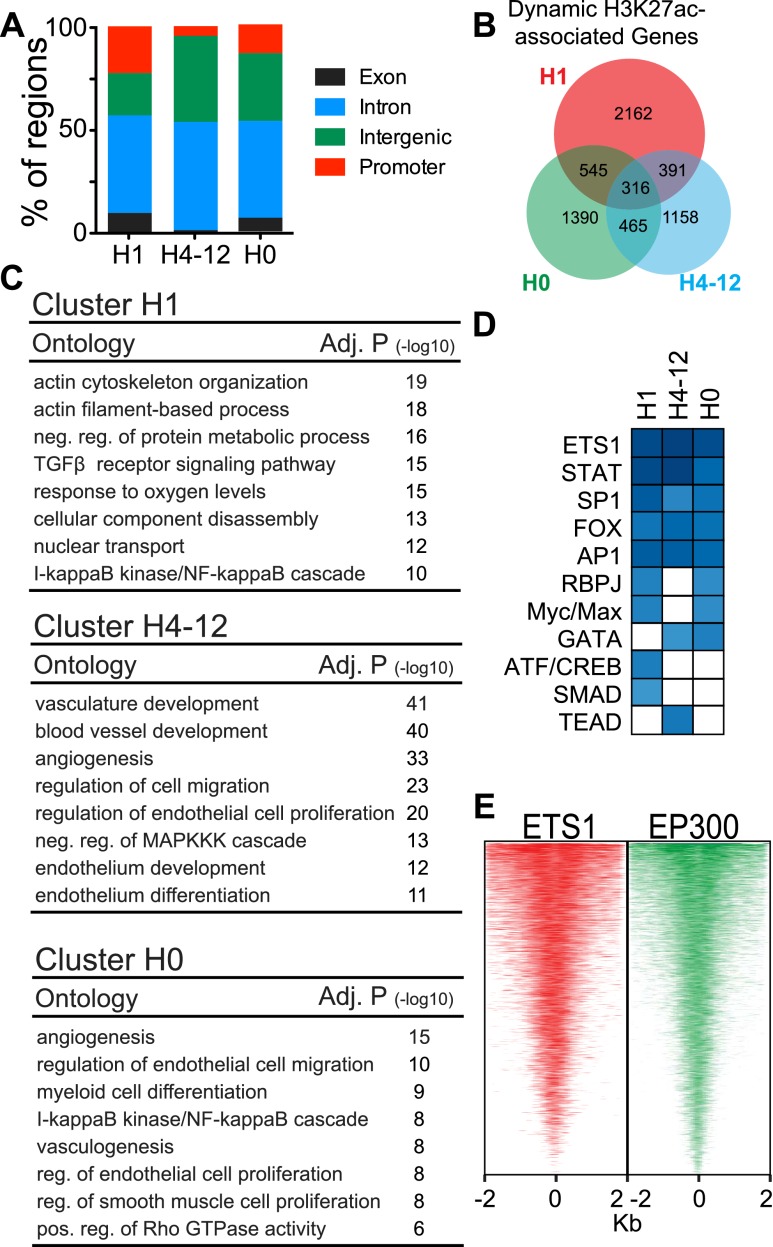
Figure 4.
Characterization of dynamic, EP300-associated H3K27ac regions. (A) Genomic distribution of dynamic H3K27ac regions. (B) Venn diagram of genes associated with the three clusters of dynamic H3K27ac regions. (C) Biological process terms were selected from the 20 most significantly enriched for dynamic H3K27ac regions. (D) Transcription factor families with enriched motifs found under EP300 peaks at dynamic H3K27ac regions. Color intensity indicates significance score (see Supplemental Table 3 for full table). (E) ETS1 and EP300 colocalized near dynamic H3K27ac regions. ETS1 and EP300 tag densities are plotted in EP300-bound regions, sorted by ETS1 tag enrichment.

