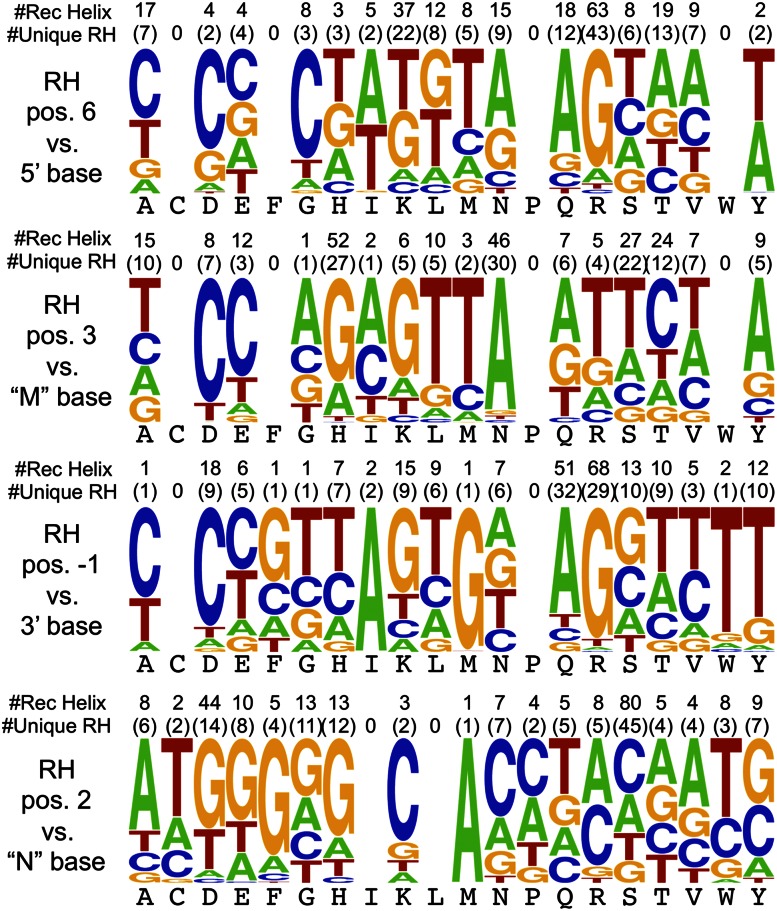
Figure 5.
Amino acid–base correlations. Frequency logo displaying the average base preference for each amino acid at each recognition position on the recognition helix (RH) assuming canonical recognition. The total number of recognition helices and the number of unique recognition helices (having a unique set of residues at positions −1, 2, 3, and 6) that contain the amino acid at that position are indicated above each logo. Base position nomenclature is defined in Figure 1B.

