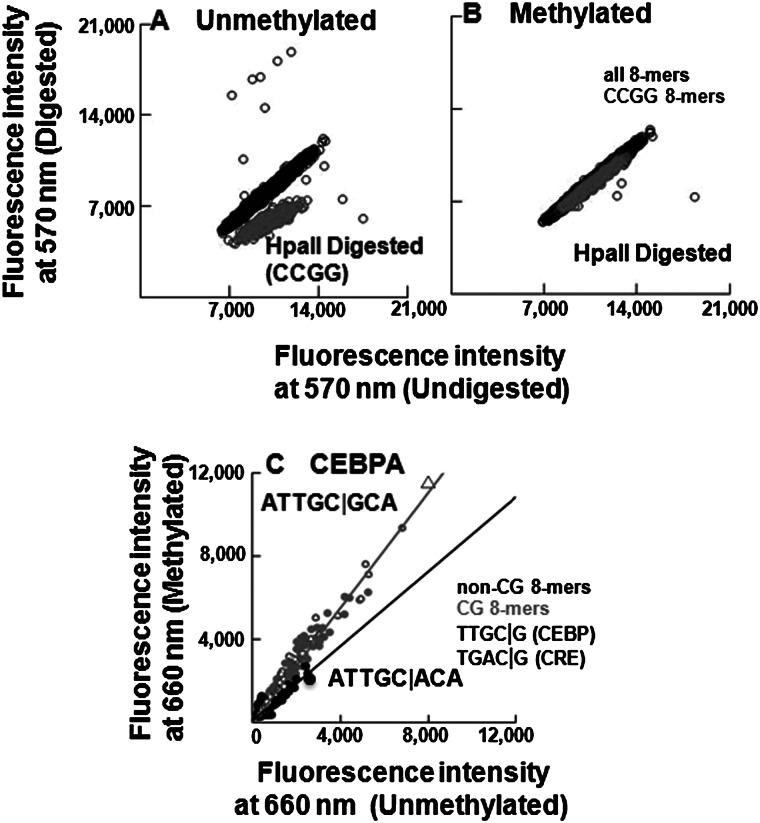
Figure 2.
Validation of CG methylation and CEBPA binding on 180K array. (A,B) Digestion of (A) unmethylated and (B) methylated 180K feature microarray using methylation sensitive (HpaII) endonuclease. Fluorescence intensities at 570 nm are plotted for all features, CCGG-containing features are colored in gray, and the remaining features are in black. (C) Scatter plot of CEBPA-GST binding to 180K array showing fluorescence intensities at 660 nm for all 65,536 8-mers in the context TNNNNNNNNA before and after methylation. The 8-mers are coded: CG (gray dots), non-CG (black dots), NTGAC|GNN (square), NTTGC|GNN (triangle). The gray line is fitted to the CG 8-mers, and the black line is fitted to the non-CG 8-mers. Binding to non-CG 8-mers did not change following methylation of the array.

