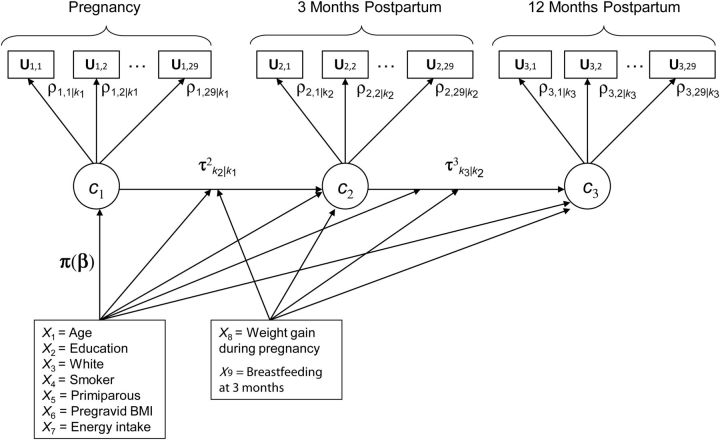
Figure 1.
Path diagram for the latent transition model to study women's changing of dietary patterns from pregnancy to 3 and 12 months postpartum, Pregnancy, Infection, and Nutrition Study, 2000–2005. Circles represent latent (i.e., unobserved) variables; squares represent observed variables; and arrows represent “causal” relationships. For explanations of statistical notations, see the Materials and Methods section. BMI, body mass index.

