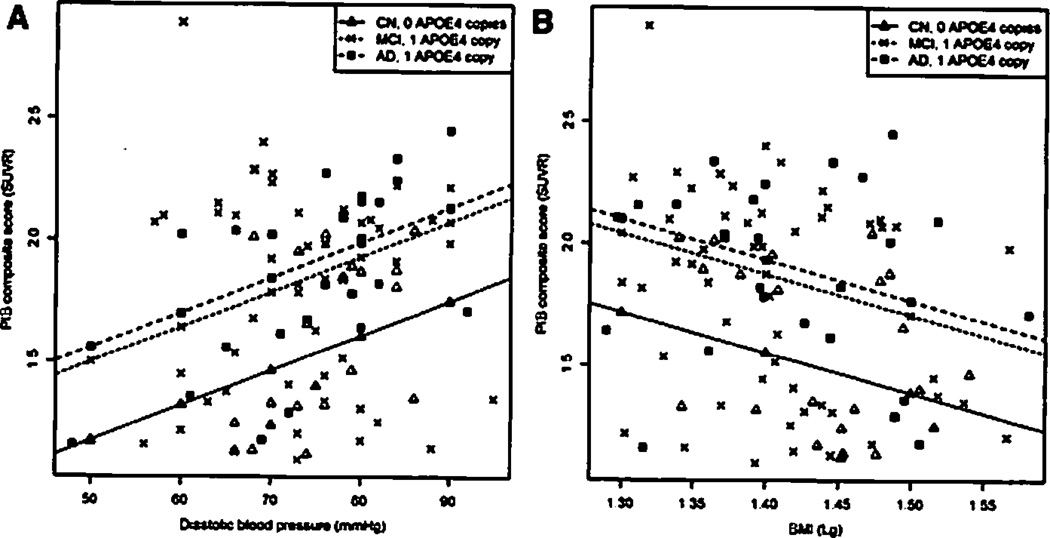
Fig. 1.
Scatterplot with predicted robust regression slope for subjects with median age and vascular risk factor values, and representing subjects who are cog-nitively normal (CN) with no apolipoprotein E (APOE) ε4 alleles, mild cognitive impairment (MCI) subjects with one APOE ε4 allele, and Alzheimer’s disease (AD) subjects with one APOE ε4 allele. Values for CN subjects are represented with triangles, MCI subjects with crosses, and AD cases with squares. (A) Diastolic blood pressure and Pittsburgh Compound B (PiB)-positron emission tomography composite score. (B) Body mass index and PiB composite score.

