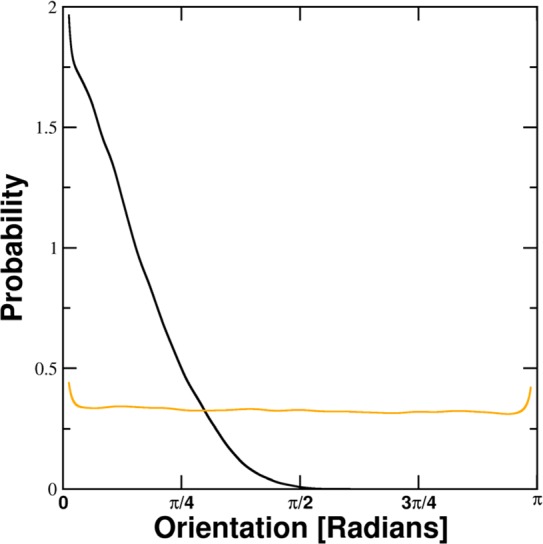
Figure 2.

Shape of obtained probability distributions after 1/sin(x) normalization. The black line is the calculated probability distribution of the dipole moment angle relative to the electrostatic potential gradient of the ion within the 2.4–2.5 Å shell around Na+. It exhibits a sharp maximum at 0. The orange line depicts the distribution of dipole orientations of the same system within the 15.0–15.1 Å shell. Except for small normalization artifacts at the edges, the distribution is almost uniform.
