
Figure 3.
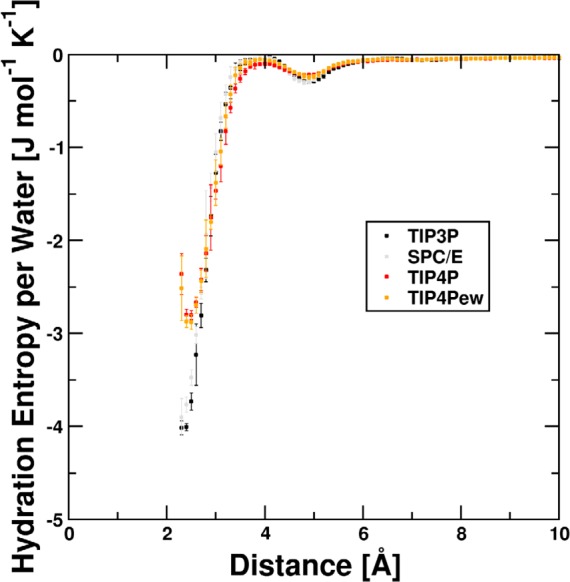
Per-water contributions to hydration entropy for Na+ for different water models. Ordered regions coincide with the hydration shells at 2.4 Å and 4.8 Å, respectively. The transition region between these shells shows almost bulk-like ordering. The statistical uncertainty in the innermost shells is significantly larger than in the outer regions as the occupancy is smaller. Subsequently, volume-normalized integration is performed.