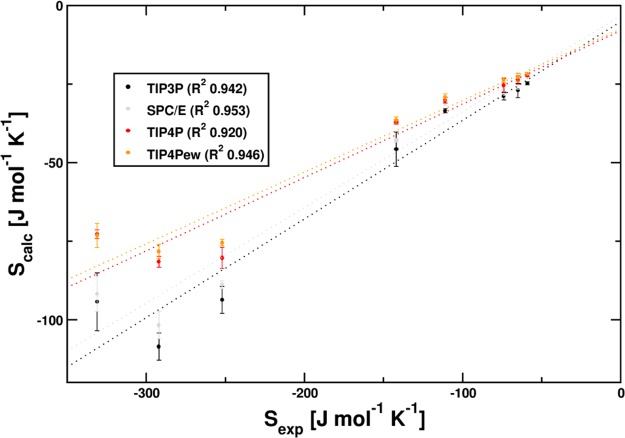
Figure 4.
Comparison of calculated vs experimental hydration entropy for different water models. Calculated results amount to one-third of experimentally determined values. Although the water model affects the slope, relative distances are well preserved. (left to right: Mg2+, Mn2+, Ca2+, Li+, Na+, K+, Rb+, Cs+) The squared correlation coefficients R2 of linear fits to experimental hydration entropy values of Marcus are calculated to be between 0.92 and 0.95 for all water models. Correlation of experimentally obtained values and calculated results is depicted in Figure 4.

