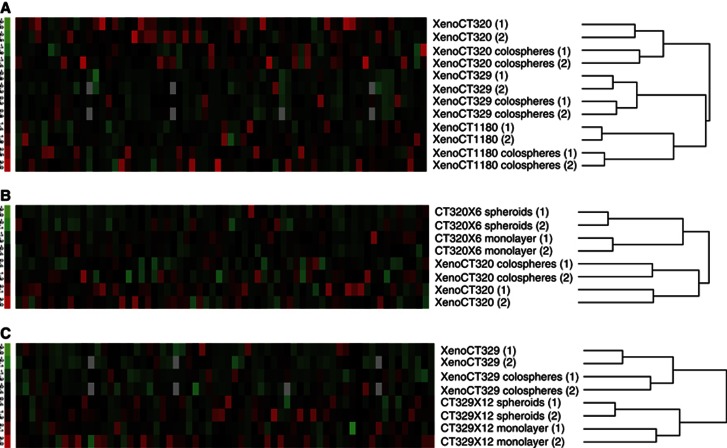
Figure 4.
Colospheres closely match origin tumour tissue contrary to the paired cell lines cultured as spheroids or monolayers. (A) Hierarchical clustering based on the expression of 64 selected genes (listed in Supporting Information Supplementary Table S1) in colospheres and corresponding xenografts from XenoCT320, XenoCT329 and XenoCT1180 models. Two independent pairs of colospheres and parental xenograft tissue for each model are studied. (B and C) Hierarchical clustering based on the expression of the 64 genes in colospheres, the original xenograft, and the derived cell line studied as monolayer and spheroids is shown for (B) XenoCT320 system model and (C) XenoCT329 system model. Each column represents a gene. The expression index is standardised genewise to have mean 0 and s.d. 1 (−3.0, green to +3.0, red).

