Figure 5.
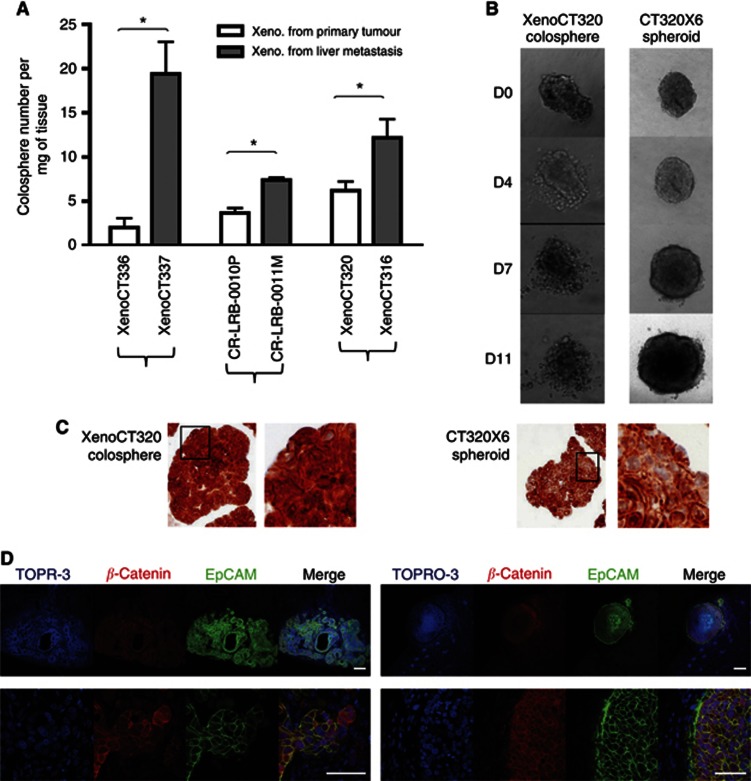
Aggressiveness properties of colospheres. (A) Number of colospheres per mg of tumour xenograft tissue, generated from three patient colon primary adenocarcinomas (white) and their paired liver synchronous metastases (grey). Data represent mean±s.d. of three experiments for each model *P<0.05. (B) XenoCT320 colospheres and CT320 × 6 spheroids were embedded in collagen I. Pictures were taken at days D0–D11 after embedding. (C) Anti-β-catenin immunostaining on XenoCT320 colospheres and CT320 × 6 spheroids in cytoblock assay. Magnification × 20. At the right of each picture, higher magnification of the boxed area. (D) Colospheres and spheroids display in vivo distinct pattern of tumour development and β-catenin expression. Immunofluorescent staining of tumour section after kidney capsule injection of the equivalent number of human colon cancer cells (105) of whole XenoCT320 colospheres (left) or whole CT320 × 6 spheroids (right). Human EpCAM and β-catenin were visualised in confocal microscopy. Nucleus counterstaining with TOPRO-3. Scale bar: upper panels, 200 μm. Lower panels, 50 μm.

