Figure 7.
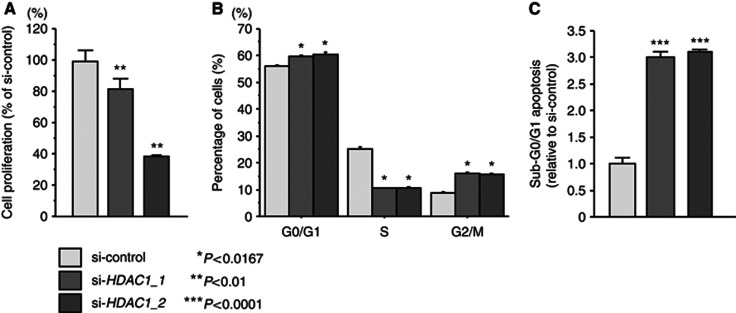
Effect of si-HDAC1 transfectants on cell proliferation, cell cycle and apoptosis in SAS cells. (A) Suppression of cell proliferation after transfection of si-HDAC1_1 and si-HDAC1_2 into SAS cells as determined by XTT assay. (B) Typical results of cell cycle analysis of si-control, si-HDAC1_1 and si-HDAC1_2 transfectants. The bar chart represents the percentage of the cells in the G0/G1, S or G2/M phase. (C) Typical results of cell apoptosis analysis of mock, si-control, si-HDAC1_1 and si-HDAC1_2 transfectants. Trials were independently conducted three times. *P<0.0167, **P<0.01, ***P<0.0001.

