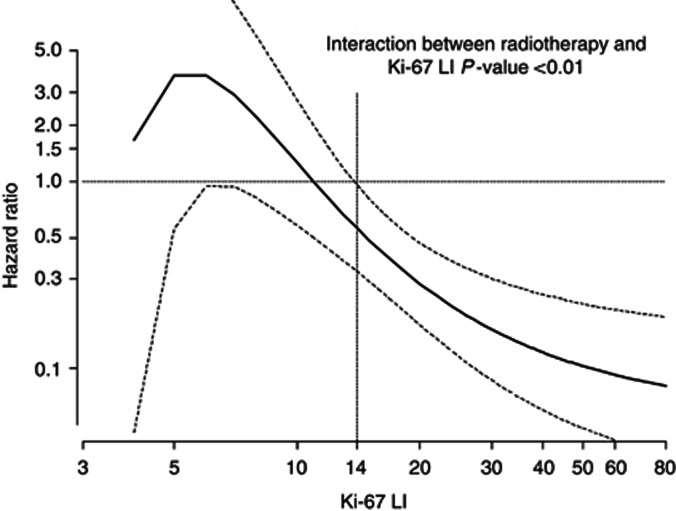
Figure 5.
The solid curve represents the continuous relationship between Ki-67 LI and the effect of radiotherapy on the occurrence of ipsilateral recurrence. HR=1: no effect of RT. HR<1: protective effect of RT. The underlying model is adjusted for menopause, body mass index, surgical margins, HER2, ER, grade, presence of necrosis and microcalcifications and HT. Dotted lines represent the 95% CIs. Ki-67 LI is reported in a log scale.

