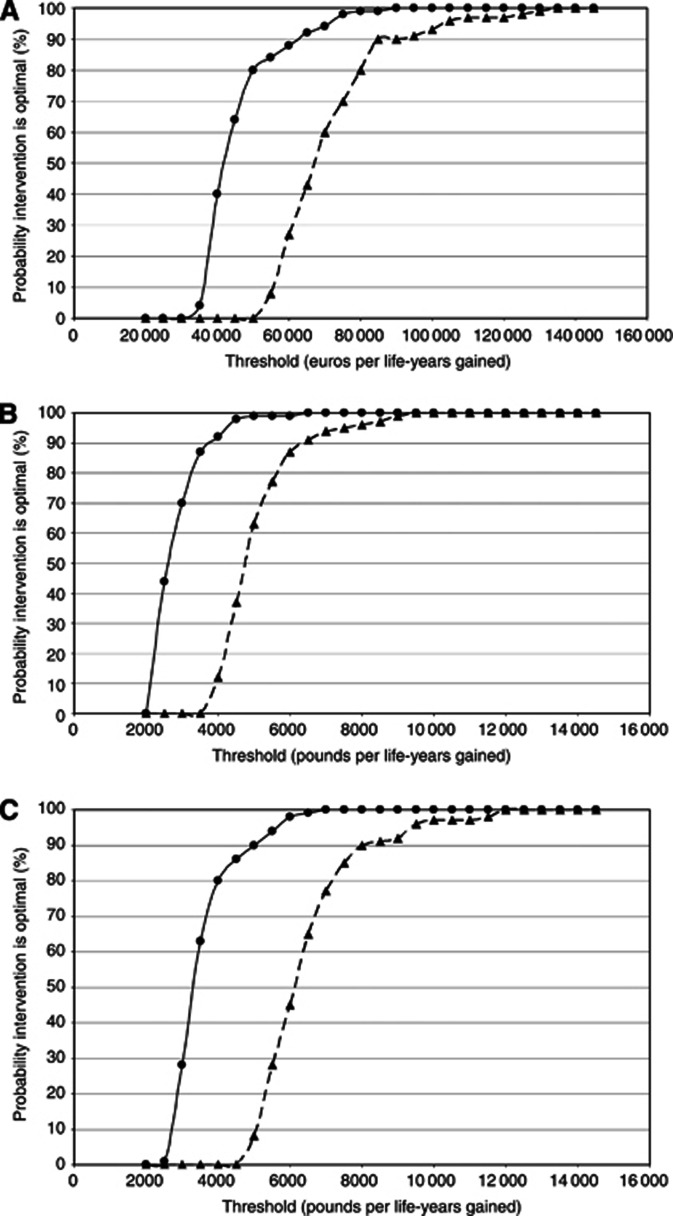
Figure 1.
Cost-effectiveness acceptability curves. Cost-effectiveness acceptability curves for the implementation of the US screening strategy in the Netherlands (A), of the Dutch screening strategy in the United Kingdom (B) and of the US screening strategy in the United Kingdom (C) for BRCA1 (solid line, circles) and BRCA2 (dashed line, triangles) mutation carriers. Shown is the probability that the alternative intervention is cost effective at a certain cost threshold in euros or pounds per life-years gained.

