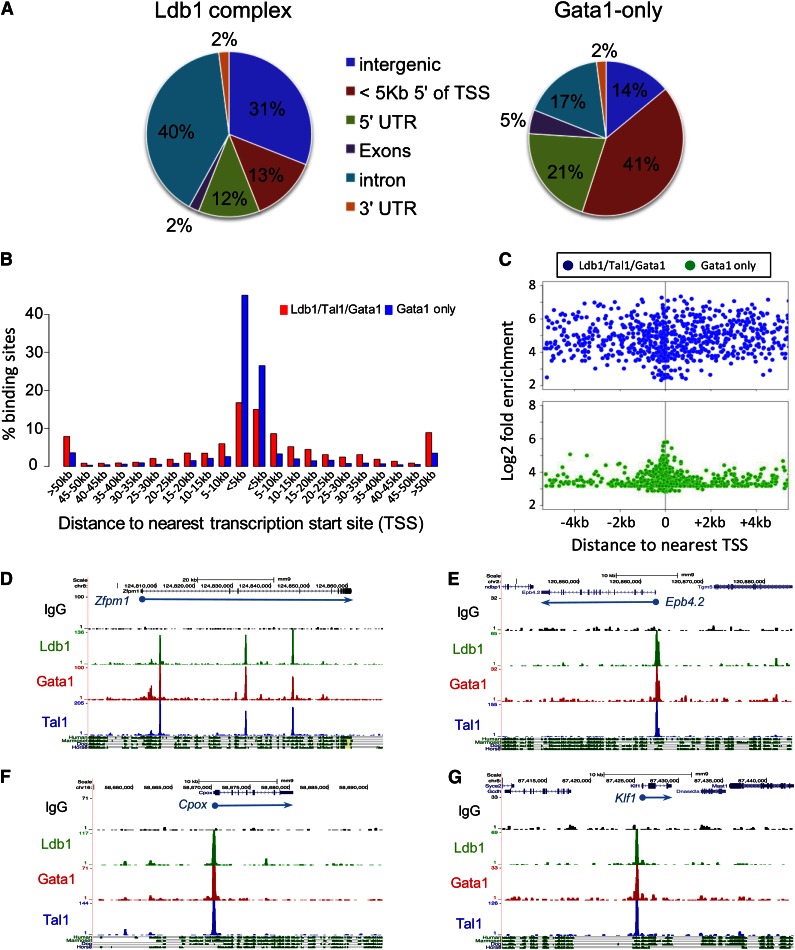
Figure 2.
Location of Ldb1 complex binding sites. (A) Genomic distribution of (left) Ldb1 complex binding sites or (right) non-Ldb1/Tal1-associated (Gata1 only) binding sites. (B) Location of all Ldb1 complex binding sites and Gata1-only binding sites relative to the nearest gene. Bar heights indicate percentage of all Ldb1 complex binding sites (red) or non-Ldb1/Tal1 associated Gata1-only binding sites (blue) that map to the indicated distance from a known gene. (C) Distribution of all Ldb1 complex binding sites (blue) and all Gata1-only binding sites (green) located within 4 kb of a TSS. y-axis shows Log2 fold enrichment of ChIP-Seq tag number/input tag number. (D-G) UCSC Genome Browser shots showing Ldb1, Tal1, and Gata1 binding sites at (D) Zfpm1 (Fog1), (E) Epb4.2, (F) Cpox, and (G) Klf1. y-axis shows number of sequence reads. Mammalian conservation tracks are shown at the bottom.

