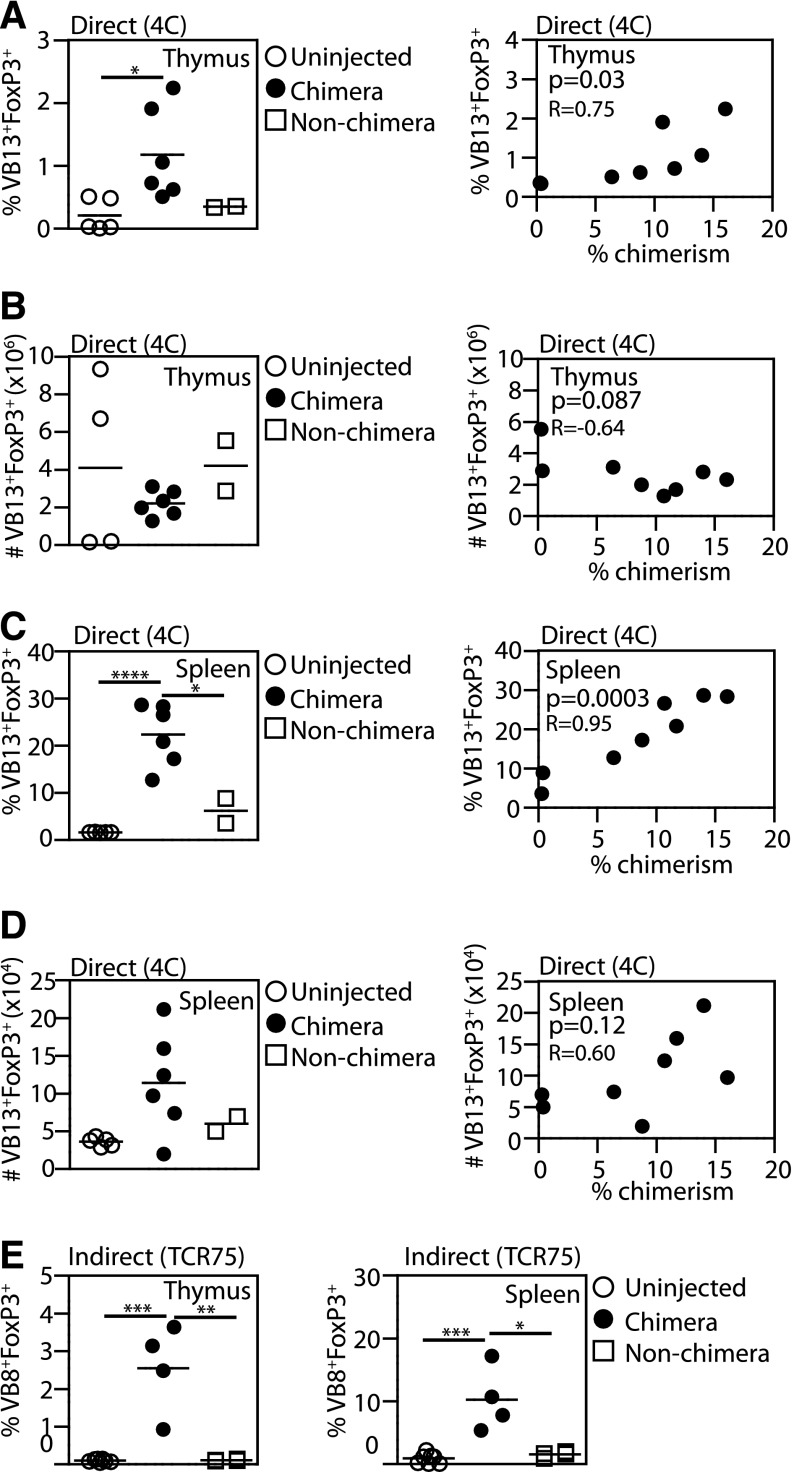
Figure 4.
Enrichment of antigen-specific Tregs in engrafted mice. 4C (direct pathway, A-D) or TCR75 (indirect pathway, E) fetuses were transplanted with BALB/c fetal liver cells and the percentage of TCR-Tg CD4+Foxp3+CD25+ Tregs among TCR-Tg CD4 cells was compared among chimeras, injected nonchimeras, and uninjected animals. TCR-Tg cells were identified by staining for CD4 and Vβ13 (4C hosts) or Vβ8 (TCR75 hosts). Comparisons were made between cell percentages (A,C,E) or absolute cell counts (B,D). Pearson correlations were used to compare the percentage of 4C Tregs and the percentage of chimerism. 4C: uninjected, n = 5; chimera, n = 6; nonchimera, n = 2. TCR 75: uninjected, n = 7; chimera, n = 4; nonchimera, n = 4. P values: *<.05; **<.01; ***<.001; ****<.0001.

