
Fig. 5.
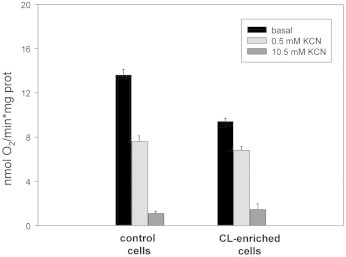
Endogenous respiration of CL-enriched cells after KCN exposure. O2 consumption rates of control cells (left) and CL-enriched cells after KCN exposure (right) were compared. Cells after exposure to 10.5 mM KCN, as described in Fig. 4, were harvested, washed and then 20-fold diluted in LB medium. Then O2 consumption rate was measured in the absence (black bars) and in the presence of 0.5 or 10.5 mM KCN (light- and dark-grey bars), as described in Section 2. Each experimental data point has been repeated at least three times starting from at least three independent cultures.