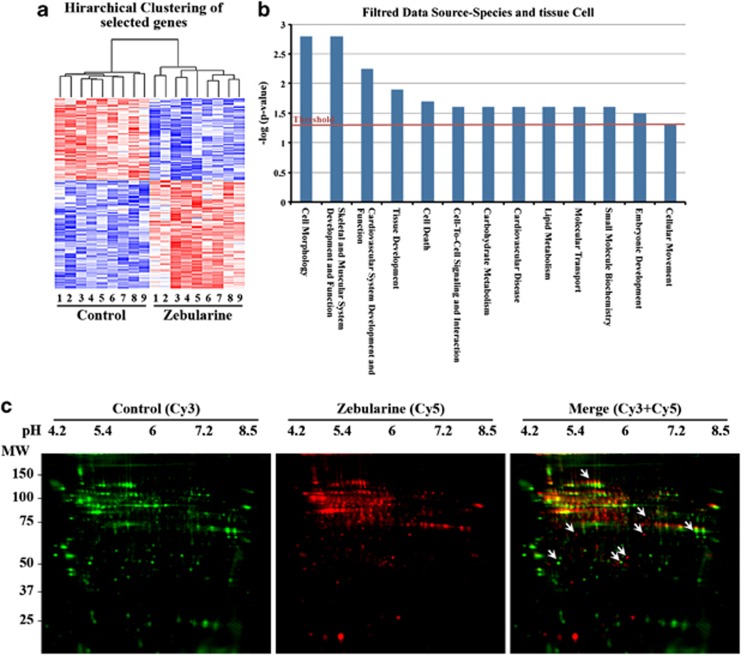
Figure 6.
Microarrays, IPA analysis and proteomics assays for zebularine-treated cells. (a) Hierarchical clustering of the gene expression changes between zebularine and Control. The columns represent different replica of each condition replica. A red color represents upregulation, whereas a blue color represents downregulation. (b) Plot for biological functions generated by IPA analysis showing enhanced threshold for those related to cardiomuscular development. Enrichment score (y axis) is reported as the minus log transformation on the geometric mean of P-values from the enriched annotation terms associating with one or more of the gene group members. The genes are clustered into significantly enriched groups for specific biological functions. (c) Comparison of control- and zebularine-treated cells proteins using 2D-DIGE. Protein fractions from control were labeled with Cy3 (green) and zebularine ones with Cy5 (red), and then mixed. The mixed protein samples were separated by isoelectric focusing, and then SDS-PAGE. Merge picture from the superposition of fluorescence images shows a pool of proteins with differential mobility in zebularine condition (arrows)

