Figure 7.
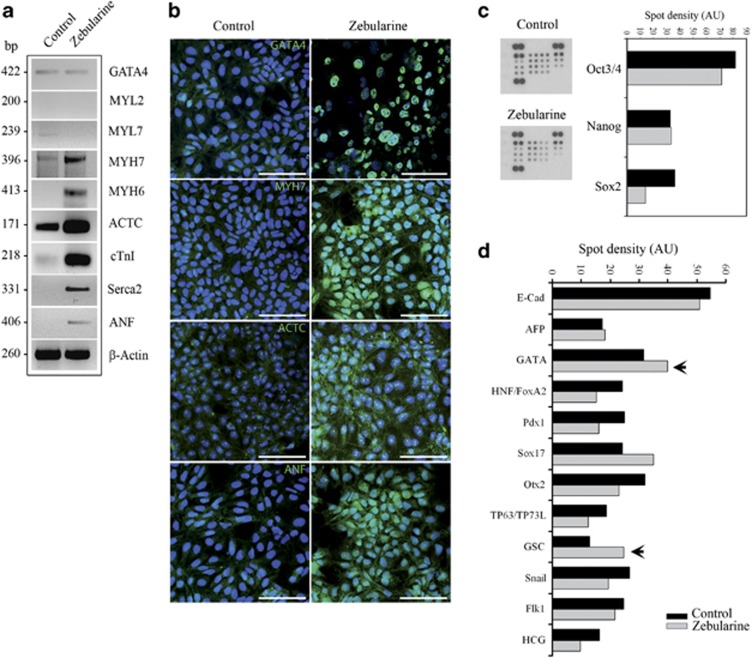
Characterization of HS-181 cell line after treatment with zebularine. (a) RT-PCR of cardiac markers after treatment with zebularine. Myh7, Myh6, Actc, cTnI and Serca2 present more expression after treatment. (b) Immunostaining of treated cells to detect cardiac-specific proteins. Scale bars; 50 μm. (c) Blots of Proteome Profiler Array and the resulting quantification histograms demonstrating inhibition of pluripotency marker expression and (d) increased levels of mesodermic proteins after zebularine treatment (black arrows)

