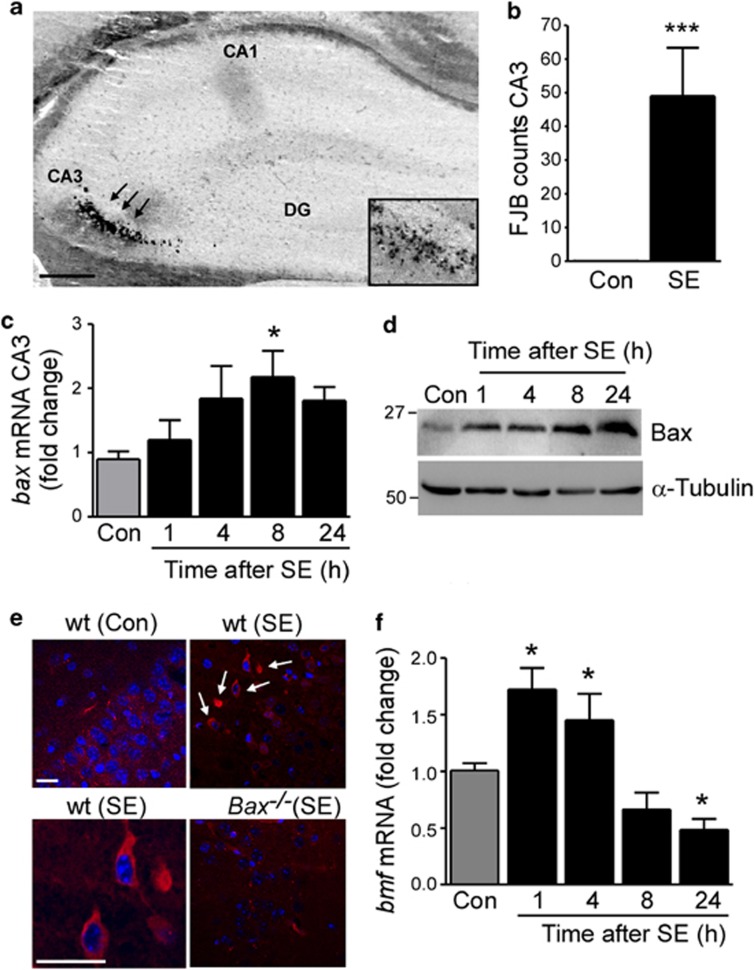
Figure 1.
Bmf induction after SE. (a) Representative photomicrograph of a coronal brain section at the level of the dorsal ipsilateral hippocampus 72 h after SE showing FJB-positive cells mainly in the CA3 subfield (arrows), whereas CA1 and dentate gyrus (DG) are mainly spared from cell death. (b) Average number of FJB-positive cells at a single level of the dorsal ipsilateral CA3 hippocampal subfield 72 h after SE (n=5 per group; ***P<0.001). No cell death was observed in control (Con) non-seizure mice. (c) Graph showing increased bax mRNA in cell death-susceptible ipsilateral CA3, 8 h after SE (n=4 per group; *P<0.05) when compared with ipsilateral CA3 from control (Con) mice. (d) Representative western blots (n=1 per lane) of cell lysates from ipsilateral CA3 subfield showing increased levels of Bax after SE when compared with ipsilateral CA3 from control (Con) mice. α-Tubulin is shown as a loading control. (e) Confocal immunofluorescence photomicrographs showing cells positive for active Bax 8 h after SE in the CA3 region of the hippocampus. Note, no specific staining was present in the CA3 subfield of bax-deficient mice 8 h after SE (bottom right panel) and in control (Con) wt mice. (f) Graph showing increased bmf mRNA levels after SE (n=7 (vehicle, control (Con)) and 5 (mice after SE)) when compared with control mice. CA=cornus ammonis. Scale bar, 250 μm (a) and 50 μm (e)

