Figure 2.
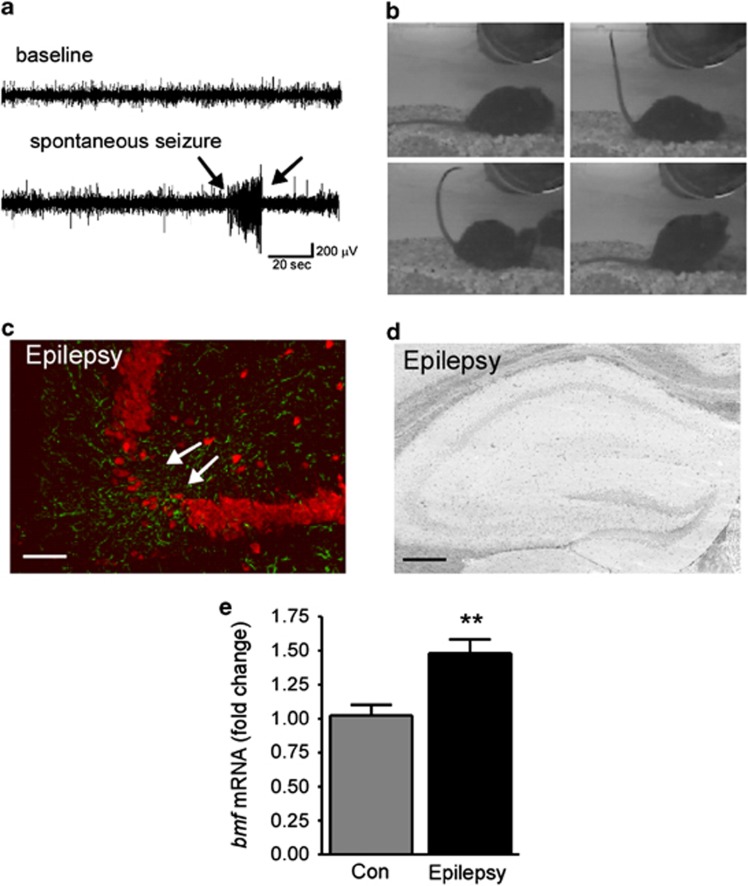
Bmf induction in mice with epilepsy. (a) Representative EEG recording of a spontaneous seizure and, (b) video stills showing typical tonic-clonic behavior during an epileptic seizure detected 14 days after SE. (c) Representative photomicrographs showing reactive astrocytes (GFAP, green) and loss of NeuN-positive neurons (red) in the ipsilateral CA3 subfield in epileptic mice 14 days after SE. Note, decreased neuronal density in ipsilateral CA3 (white arrows). (d) Representative photomicrograph of FJB-stained coronal brain section at the level of the dorsal ipsilateral hippocampus of an epileptic mouse 14 days after SE. No ongoing neurodegeneration is present. (e) Graph showing increased bmf mRNA levels in epileptic mice 14 days post SE when compared with control (Con) mice (n=8 (Con) and 5 (14 days post SE). **P<0.01 compared with control. Scale bar, 100 μm (c) and 250 μm (d)

