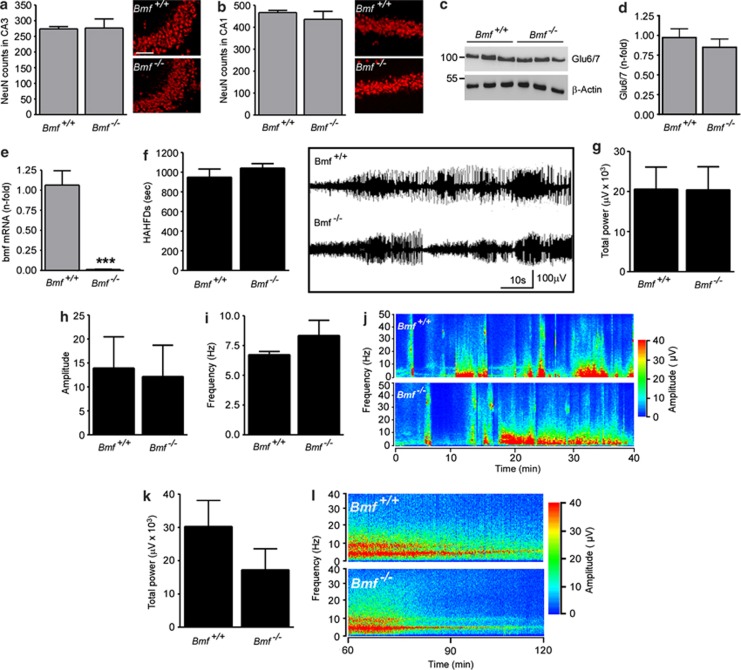
Figure 4.
Normal hippocampal morphology and response to intra-amygdala KA in Bmf−/− mice. Graph and representative photomicrographs showing similar numbers of NeuN-positive cells in the CA3 (a) and CA1 (b) subfield of Bmf +/+ and Bmf −/− mice (n=3 per group). (c) Representative western blot (n=1 per lane) and corresponding graph (d) showing similar levels of the KA receptor subtype 6 (Glu6/7) between Bmf +/+ and Bmf −/− mice. β-Actin is shown as loading control (n=3 per group). (e) Real-time qPCR analysis confirming absence of bmf mRNA was detected in Bmf −/− mice (n=4 per group). (f) Graph and representative EEG traces showing similar amount of HAHFDs during SE induced by intra-amygdala KA between Bmf +/+ and Bmf −/− mice recorded by Grass Comet digital EEG (n=10 per group). (g–i) Graphs showing similar total power, amplitude and frequency between Bmf +/+ and Bmf −/− mice during SE (n=10 per group). (j) Representative seizure spectrogram showing amplitude and frequency during SE in Bmf +/+ and Bmf −/− mice. (k) Graph and (l) representative seizure spectrogram showing amplitude and frequency for 1 h following lorazepam injection in Bmf +/+ and Bmf −/− mice. ***P<0.001 when compared with Bmf +/+. Scale bar in a, 100 μm

