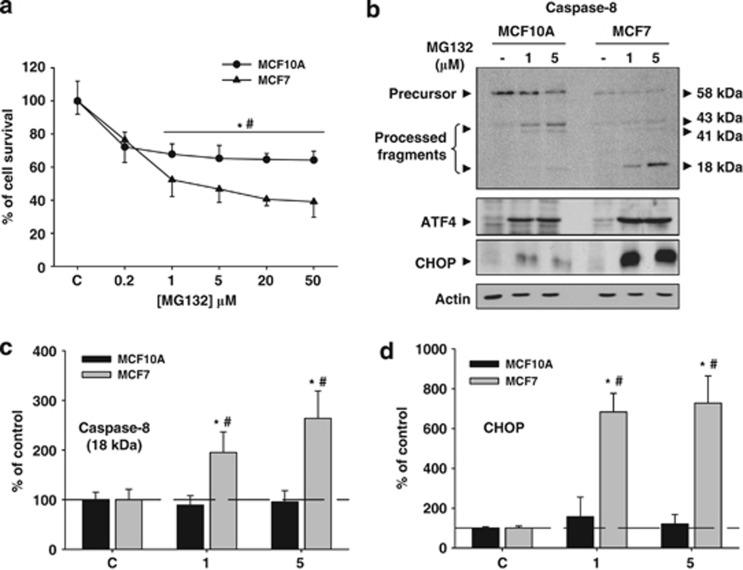
Figure 2.
PI has a different effect on cell viability in MCF10A and MCF7 cells. (a) Graph representation of SRB assays performed in MCF10A and MCF7 cells using increasing doses of MG132. Note the higher sensitivity of MCF7 cells to PI. (b) Molecular analysis of caspase-8 (upper panel), ATF4 (middle panel) and CHOP (lower panel) expressed in MCF10A and MCF7 cells in control condition and 24 h after PI (1 and 5 μM of MG132). Note the higher processing of caspase-8 and the strong expression of CHOP in MCF7 cells. (c and d) Graphs show quantification of active fragments of caspase-8 (18 kDa) and CHOP, respectively. Data are presented as mean±S.D. of three independent experiments done in parallel. *P<0.05, significant differences compared with control condition. #P<0.05, significant differences compared with MCF10A cells

