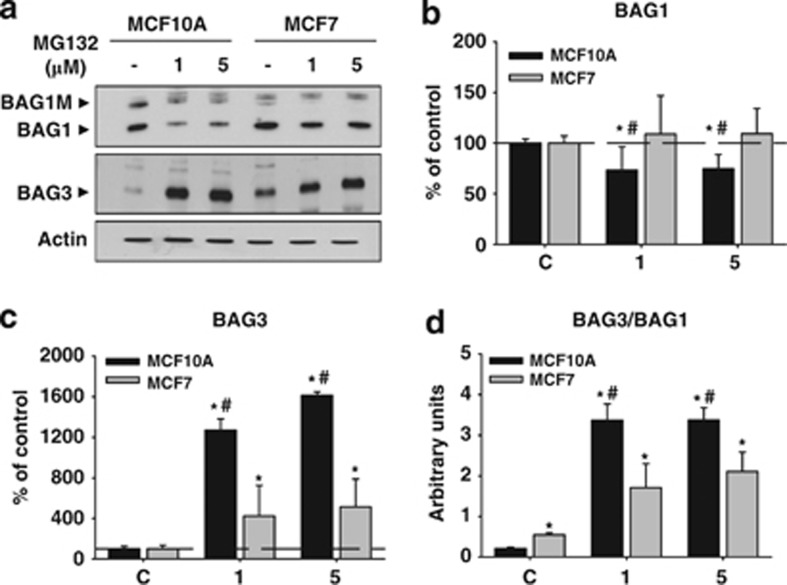
Figure 4.
BAG1 and BAG3 proteins are differentially affected by PI in MCF10A and MCF7 cells. (a) Representative western blot corresponding to the BAG1 (upper panel) and the BAG3 (lower panel) proteins expressed in MCF10A and MCF7 cells in control condition and after 24 h of PI. Note the decreased expression of BAG1 in MCF10A. (b and c) Graphs show BAG1 and BAG3 quantification, respectively. Data are presented as mean±S.D. of three independent experiments done in parallel. (d) Graph representing the BAG3/BAG1 ratio in MCF10A and MCF7 cells in control condition and 24 h after PI (1 and 5 μM of MG132). *P<0.05, significant differences compared with control condition. #P<0.05, significant differences compared with MCF10A cells

