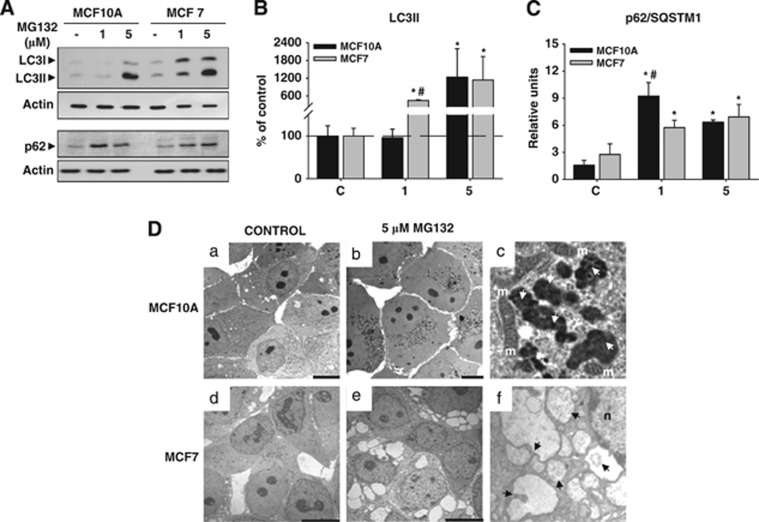
Figure 5.
Molecular and ultrastructural analysis of autophagic markers induced by PI in MCF10A and MCF7 cells. (A) Representative western blot shown in MCF10A and MCF7 cells, in control condition and after 24 h of PI the expression of LC3I and LC3II (upper panel) and p62 (lower panel) proteins, respectively. Note the dose-dependent expression of LC3II and p62 in MCF7 cells. (B and C) Graph representation of data from western blots similar as shown in (a). Data are presented as mean±S.D. of four independent experiments done in parallel. (D) TEM of MCF10A and MCF7 cells in control condition ((a) and (d), respectively) and 24 h after PI (5 μM of MG132; (b and e)). Note the presence of inclusion bodies in MCF10A cells (b) and the cytoplasmic vacuolization in MCF7 cells. (e) In (c) and (f) are shown magnifications of inclusion bodies (white arrows) and autophagic vacuoles with digestion products inside (black arrows), respectively. m, mitochondria; *P<0.05, significant differences compared with control condition; #P<0.05, significant differences compared with MCF10A cells. Scale bar 10 μm

