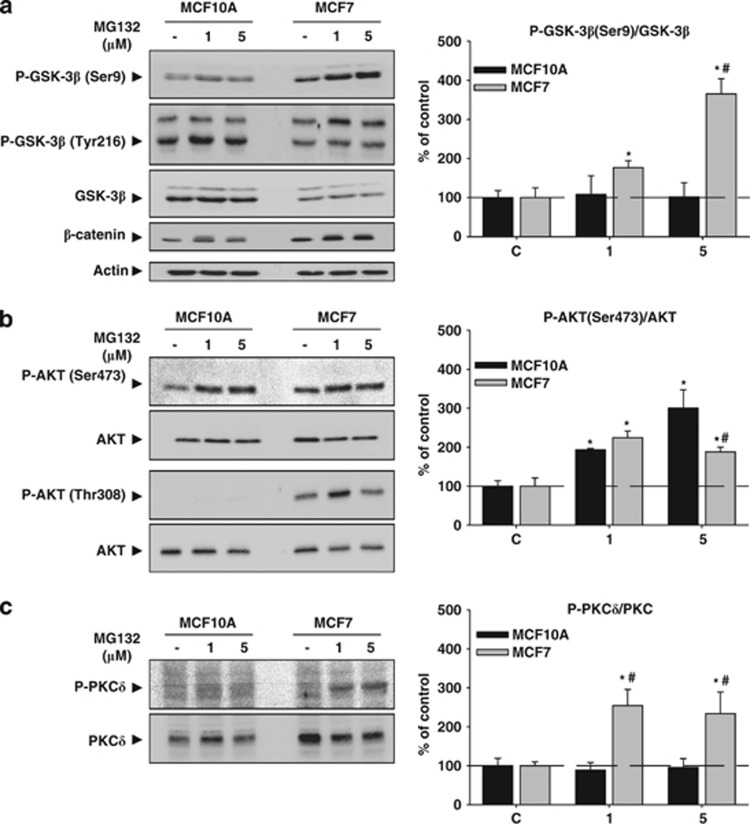
Figure 7.
Akt/GSK-3β response induced by PI in MCF10A and MCF7 cells. (a) MCF10A and MCF7 cells were treated with MG132 (1 and 5 μM) for 24 h, and then the amount of GSK-3β phosphorylated on Ser9 (upper panel) and on Tyr216 (middle panel) was analyzed. Note the dose-dependent increase of GSK-3β phosphorylated on Ser9 in MCF7 cells but not in MCF10A cells. The contrary was observed for GSK-3β phosphorylated on Tyr216. The amount of total GSK-3β was higher in MCF10A than in MCF7 cells, but PI did not modify its expression in any cell type. On the right is shown the quantification of the ratio between GSK-3β phosphorylated on Ser9 and GSK-3β in both cell types. The lower panel shows the β-catenin expression. Note the higher amount of β-catenin in MCF7 cells. (b) Similar as in (a), but analyzing Akt phosphorylated on Ser473 (upper panel) and on Thr308 (lower panel). Note the absence of Akt phosphorylated on Thr308 in MCF10A cells. On the right is shown the quantification of the ratio between Akt phosphorylated on Ser473 and Akt in both cell types. (c) Phosphorylated PKCδ and PKCδ expression in both cell types as well as quantification of the ratio between phosphorylated PKCδ and PKCδ (graph on the right). Note the higher basal expression of PKCδ and the dose-dependent increase of phosphorylated PKCδ in MCF7 cells versus the absence of it in MCF10A cells. *P<0.05, significant differences compared with control condition; #P<0.05, significant differences compared with MCF10A cells

