Figure 4.
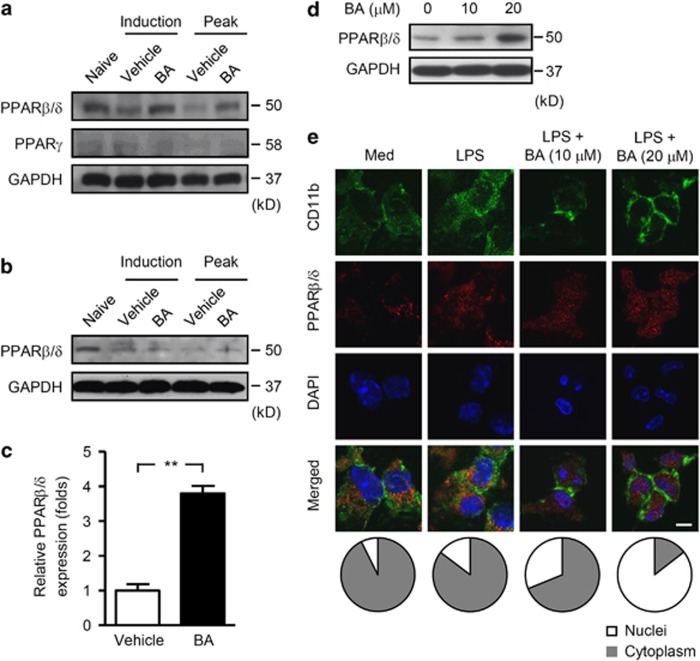
BA-induced PPARβ/δ in microglia. (a–c) EAE mice were subjected to vehicle or BA treatment with the preventive protocol, spinal cords (a) and DLNs (b) were isolated on day 10 (a representative day of induction phase) and day 20 (a representative day of peak phase) post immunization for immunoblot analyses of PPARβ/δ (a and b) and PPARγ (a). Samples isolated from naive mice were set as controls. (c) CD11b+ cells were isolated from spinal cords on day 10 post immunization for detection of PPARβ/δ by real-time PCR. Data are normalized to the gene expression in vehicle-treated mice and shown as mean±S.E.M. (n=6). (d) Primary microglia treated with vehicle or BA (10 or 20 μM) for 24 h were subjected to immunoblot analyses of PPARβ/δ. (e) Primary microglia were cultured in the absence or presence of vehicle or BA (10 or 20 μM) for 24 h and followed by stimulation with 100 ng/ml of LPS for 3 h, then subjected to immunofluorescence microscopy of CD11b (green) and PPARβ/δ (red). Cells were counter stained with DAPI (blue) to indicate nuclei. Scale bar, 20 μm (top). The fluorescence intensity of PPARβ/δ in nuclei and cytoplasm areas was quantitated using ImageJ software. The relative constituent ratios of PPARβ/δ in nuclei and cytoplasm are shown to indicate the intensity and localization of PPARβ/δ in nuclei and cytoplasm (bottom). Results in a, b, d and e are representative of three independent experiments with similar results. **P<0.01

