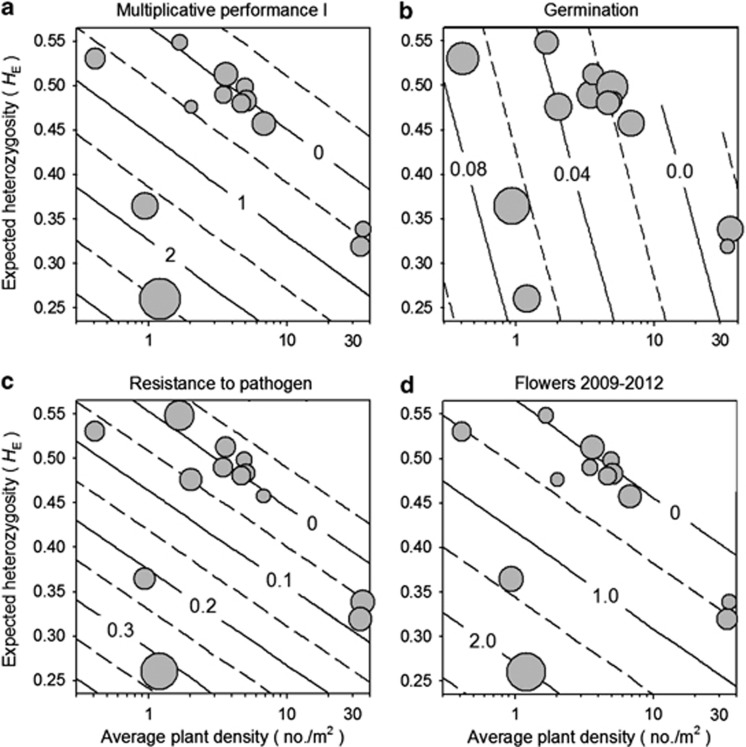
Figure 1.
Relationships between drift load estimated via heterosis in outcrossing populations of A. lyrata and expected heterozygosity, HE, and local A. lyrata density. Drift load was revealed by experimental crosses and assessment of multiplicative performance I over 4 years (a), germination (b), pathogen resistance (c) and flower production during all 4 years (d). Contour plots illustrate the models fitted in Table 2; the contour interval is the model-estimated value of drift load, as defined in Materials and methods. Symbols represent populations, with the diameter of the bubble proportional to ln(drift load+constant).

