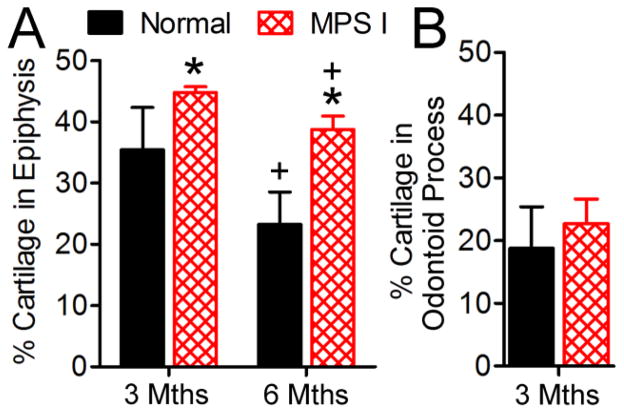
Figure 6. Quantification of cartilage area in the C2 vertebral epiphysis and odontoid process.
A. Cartilage area (inclusive of the growth plate) as a percentage of the total epiphysis area was determined from mid-sagittal Alcian blue/picrosirius red-stained histological sections, for 3 and 6 month-old samples. B. Cartilage area in the odontoid process as a percentage of total tissue area was determined from mid-sagittal Alcian blue/picrosirius red-stained histological sections, for 3 month-old samples. *p<0.05 vs normal; +p<0.05 vs 3 months.

