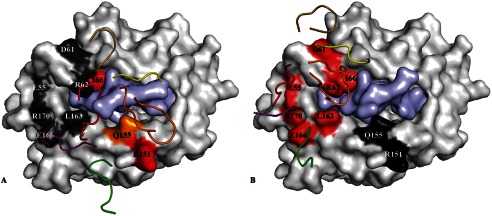
FIGURE 6.

Energetic footprints of the SB27 and SB47 TCRs on the HLA-B*35:08LPEP complex. A and B, surface representation of HLA-B*35:08 (white) with the LPEP peptide (pale purple). The energetic footprint is colored accordingly to the importance of each residue, with critical residues in red (Kdeq decrease > 5-fold); important residue in orange (5-fold> Kdeq decrease > 3-fold); dark gray indicates residues that were not important for the interaction. Panel A shows the SB27 TCR energetic footprint, and panel B shows the SB47 TCR energetic footprint. The CDR loops are represented in schematic format and colored according to the scheme used in Fig. 3.
