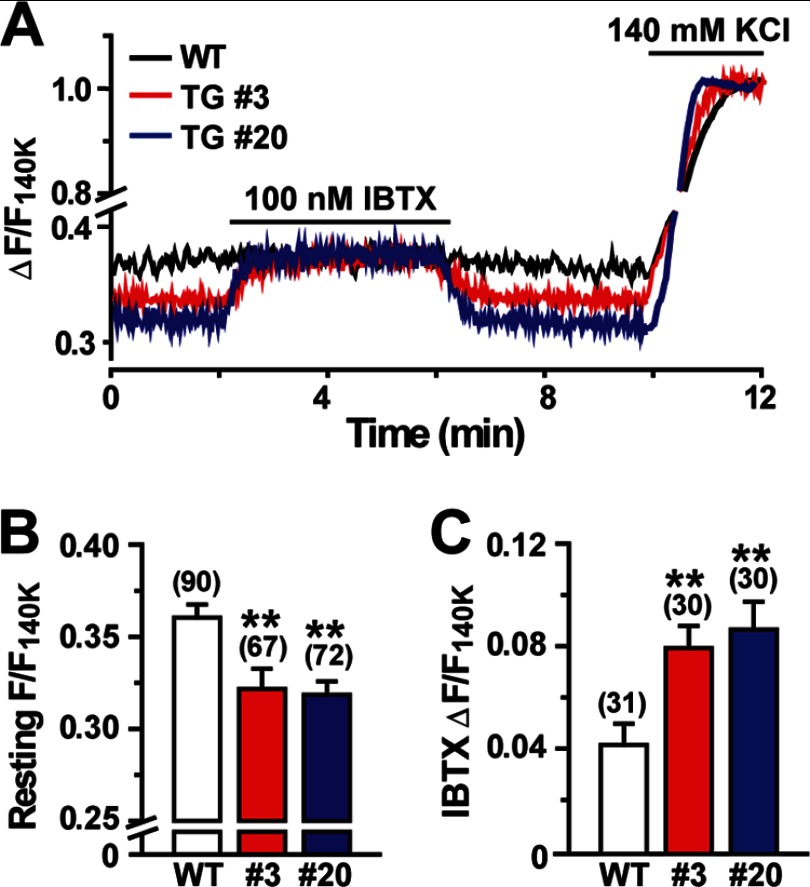
FIGURE 5.
Decreased resting membrane potential in Tric-a-overexpressing VSMCs. Single VSMCs were examined by confocal microscopic imaging using the voltage-dependent dye oxonol VI. Cellular fluorescence intensities were normalized to the maximum value to yield the fractional intensity (F/F140K). A, shown are representative imaging data. B, shown are the summarized data of the resting intensity. C, shown are the summarized data of the intensity shift by iberiotoxin (IBTX). The data represent the mean ± S.E., and the numbers of cells examined from at least three mice are shown in parentheses. Significant differences between the genotypes are indicated by asterisks (**, p < 0.01 by t test).

