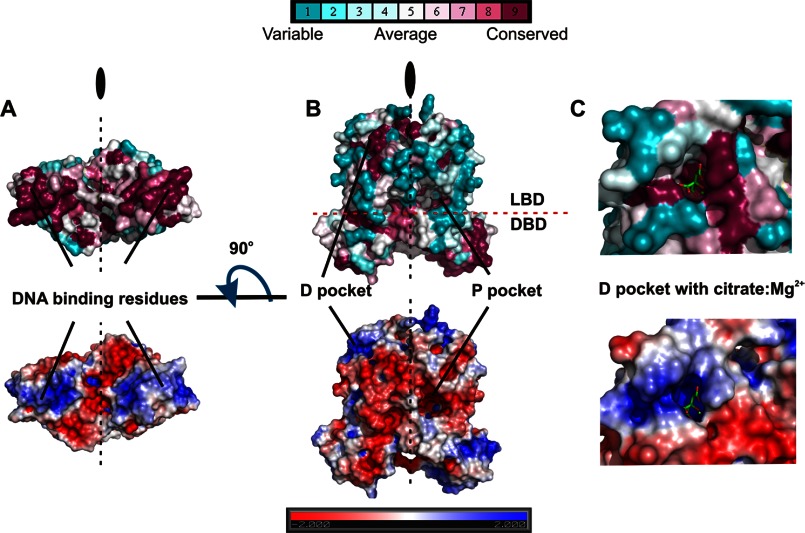
FIGURE 4.
Electrostatic potential and residue conservation in the AcnR DNA binding region (A) and pockets (B and C). The protein is displayed as a surface colored by residue conservation (top) and electrostatic potential (bottom). Residue conservation ranges from fully conserved in purple to not conserved (cyan). Citrate (green carbons) is shown as cylinders in C.

